The Trade Desk, Inc.'s management explains the business in its own materials. The slides below do the most of that work, pulled from the documents preserved in Sources. Each source link opens the complete presentation at that slide in a new tab.
The current overview deck: what the platform does, the market it sits in, and the four growth drivers management is betting on. · Open the full document →
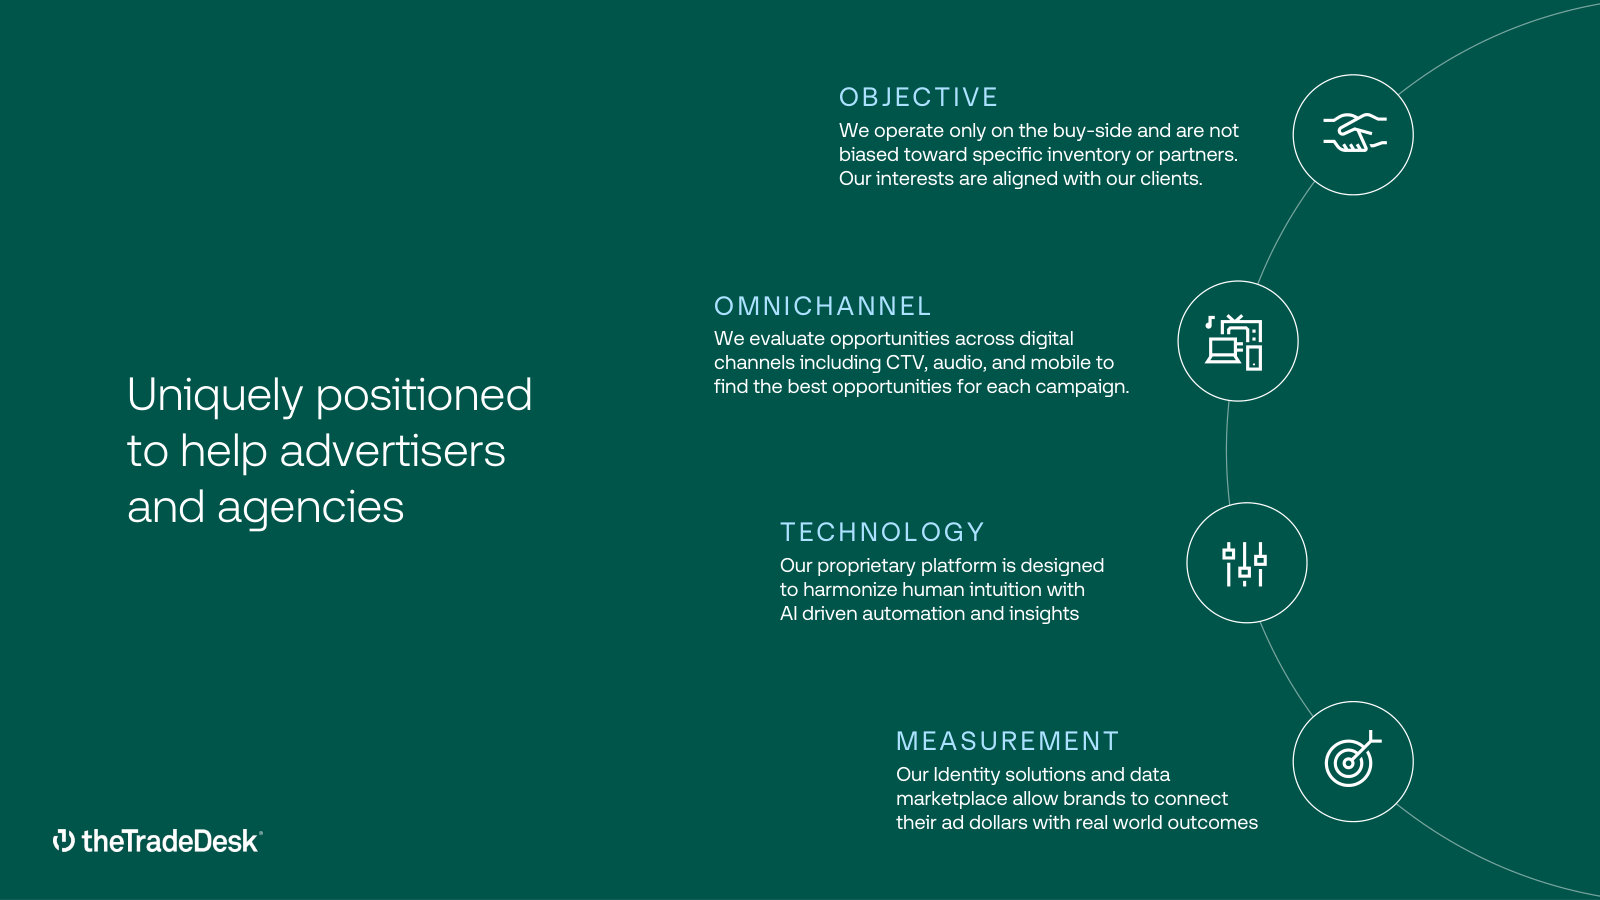
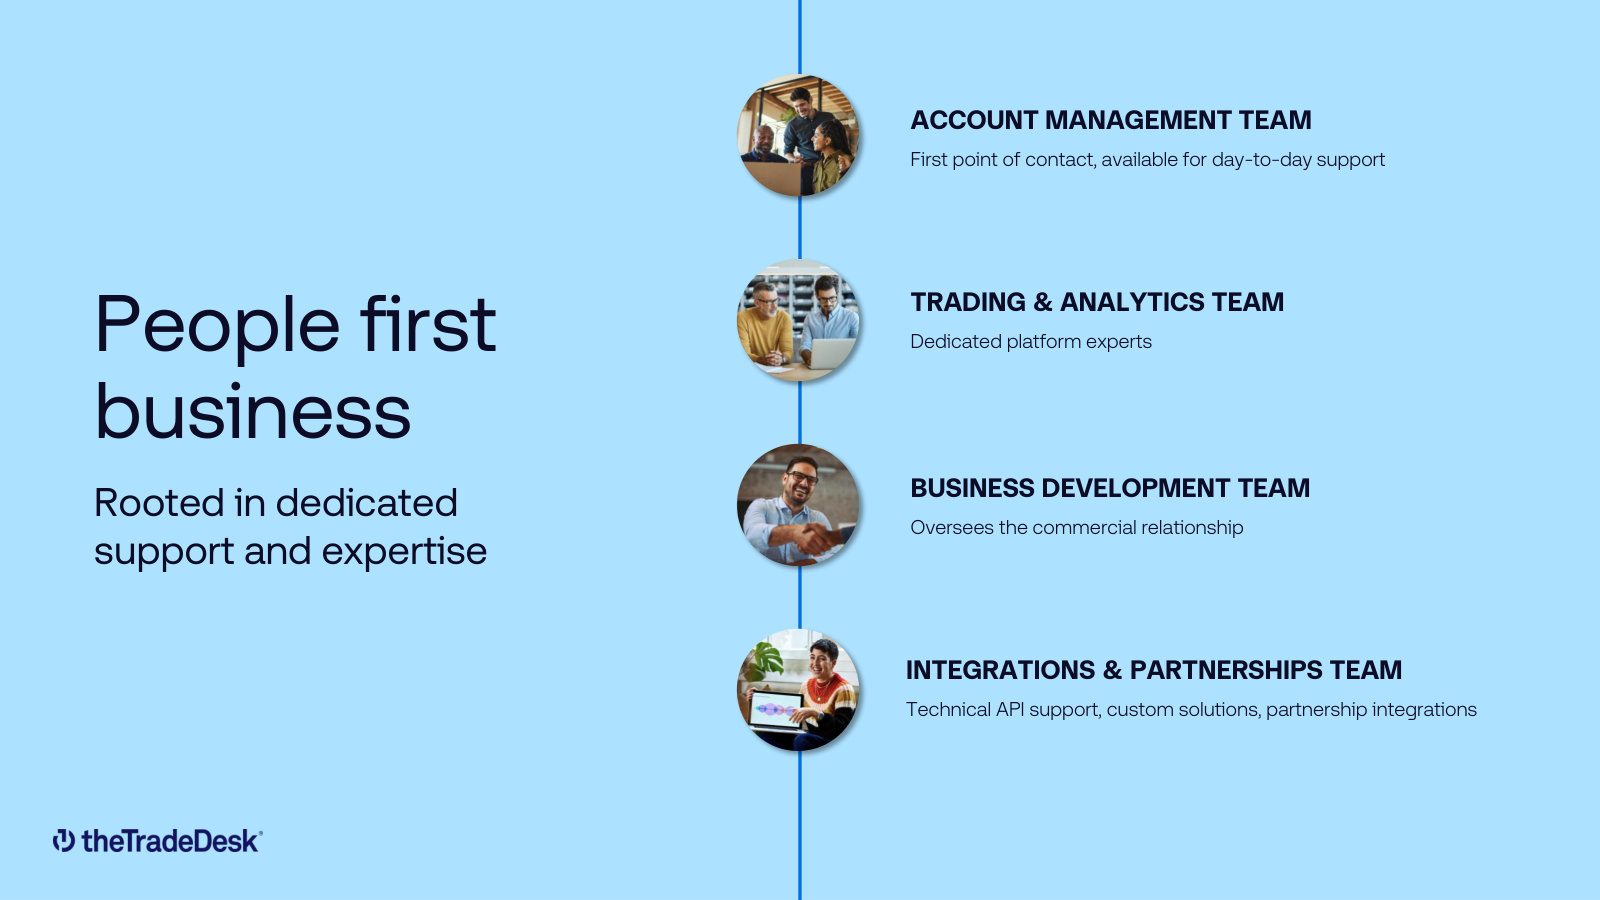
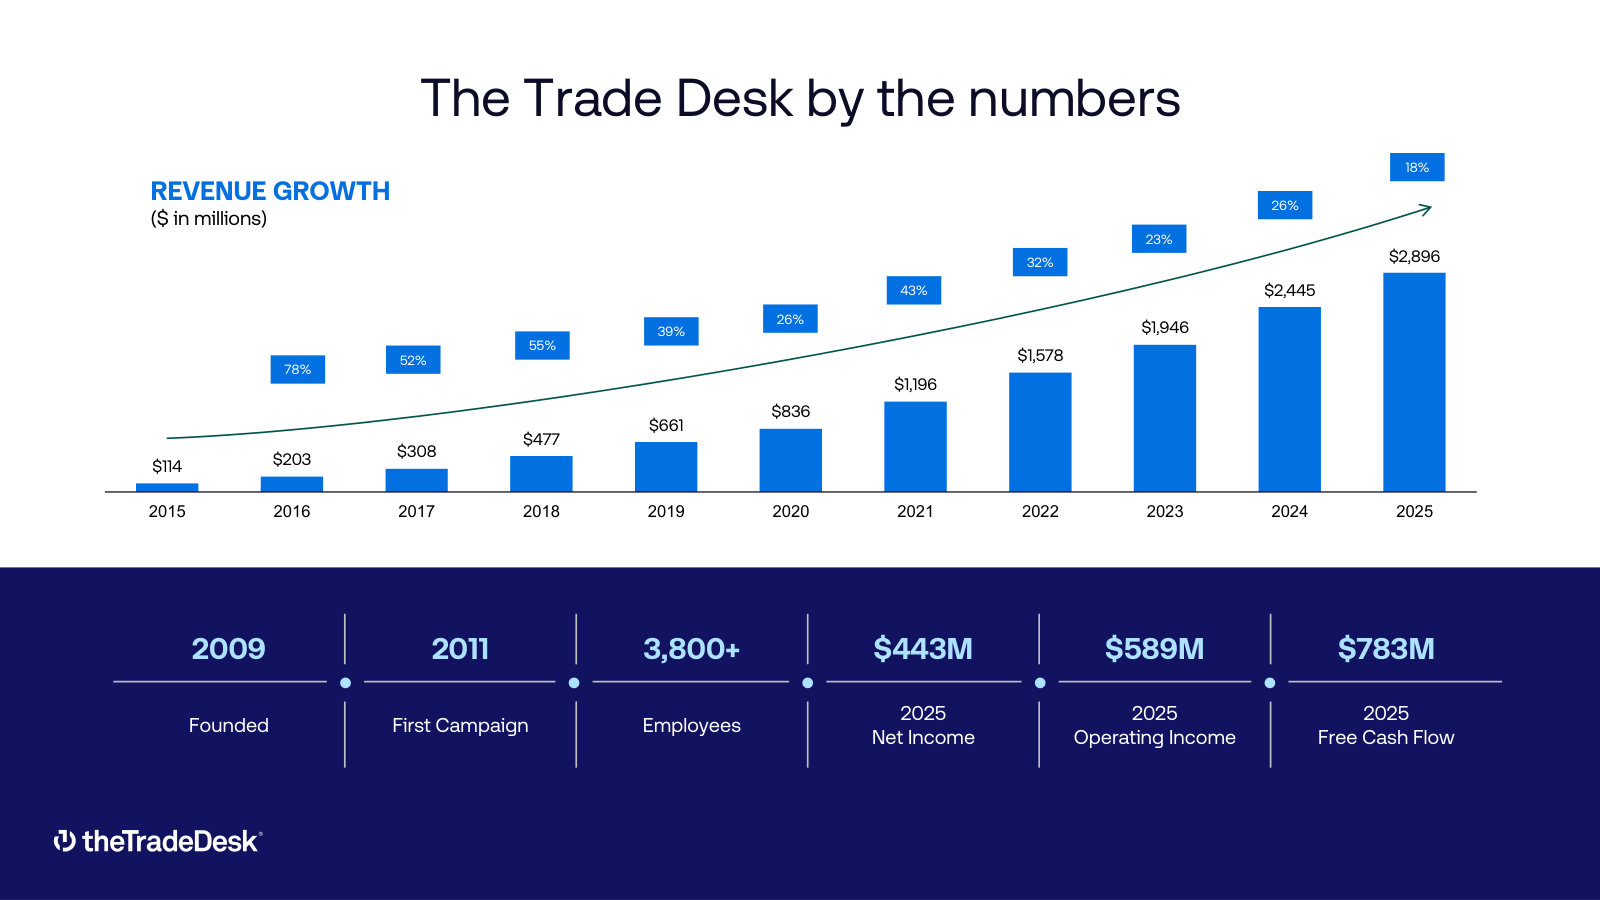
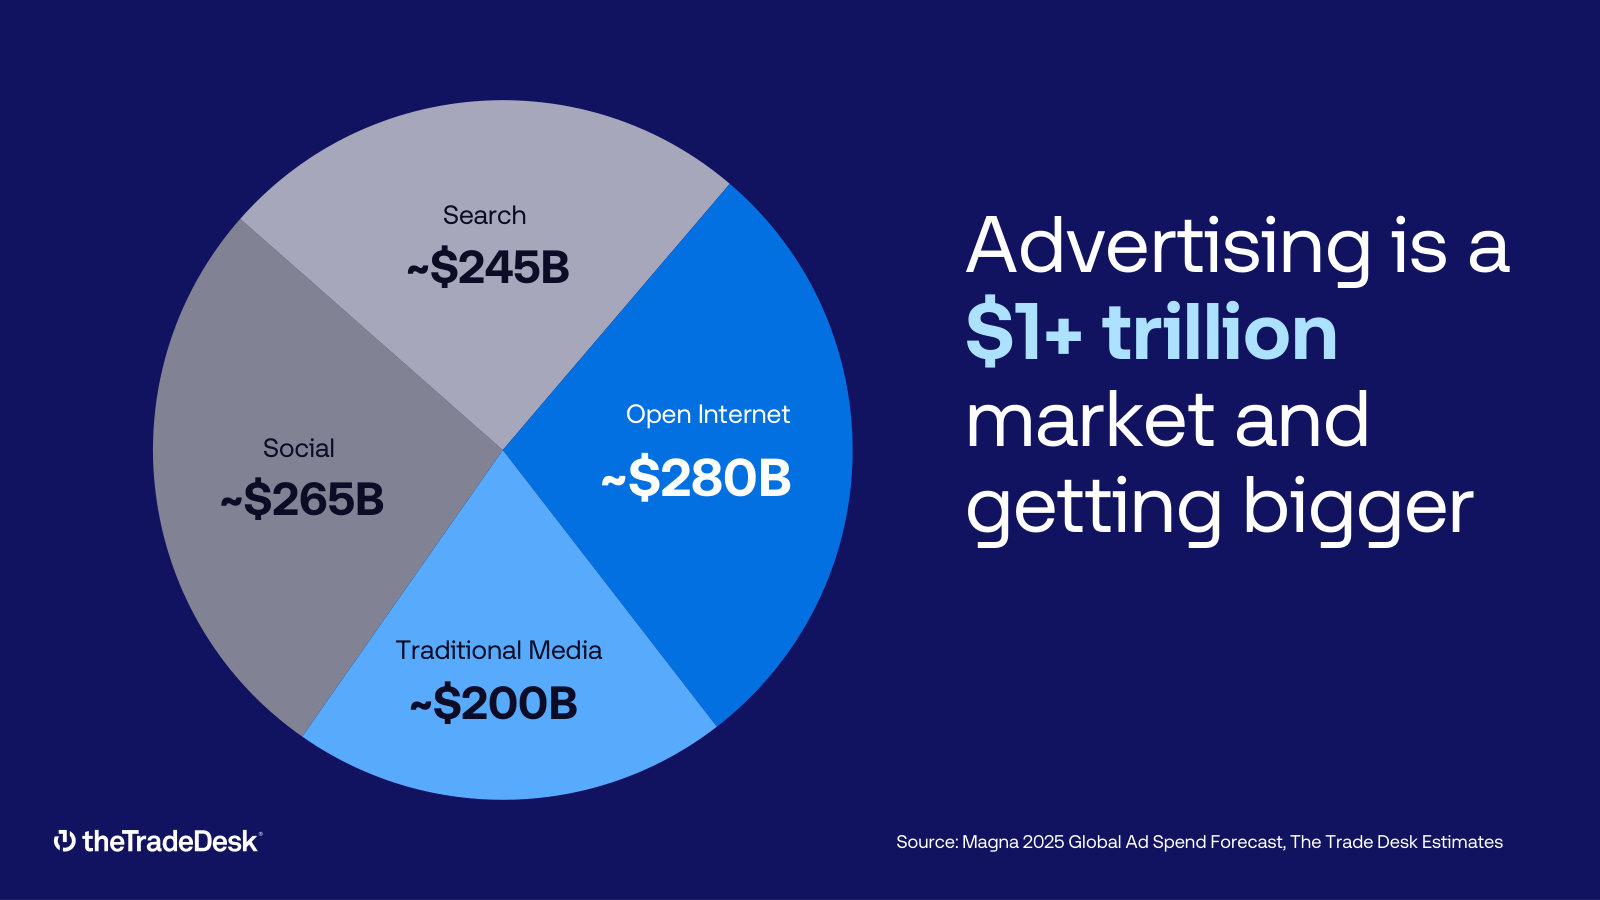
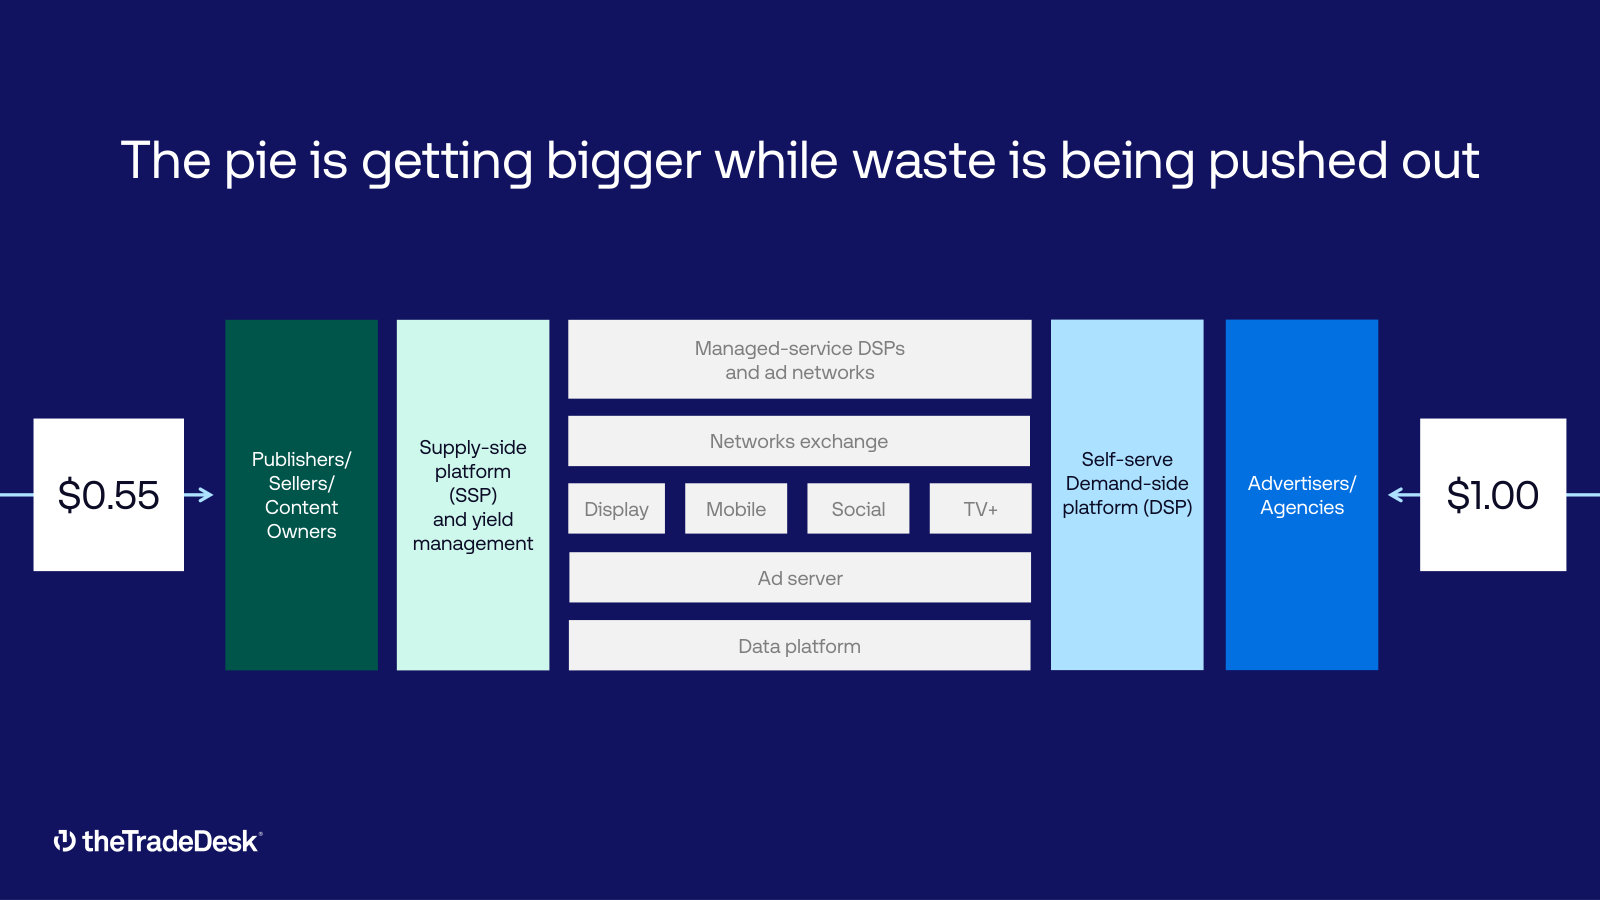
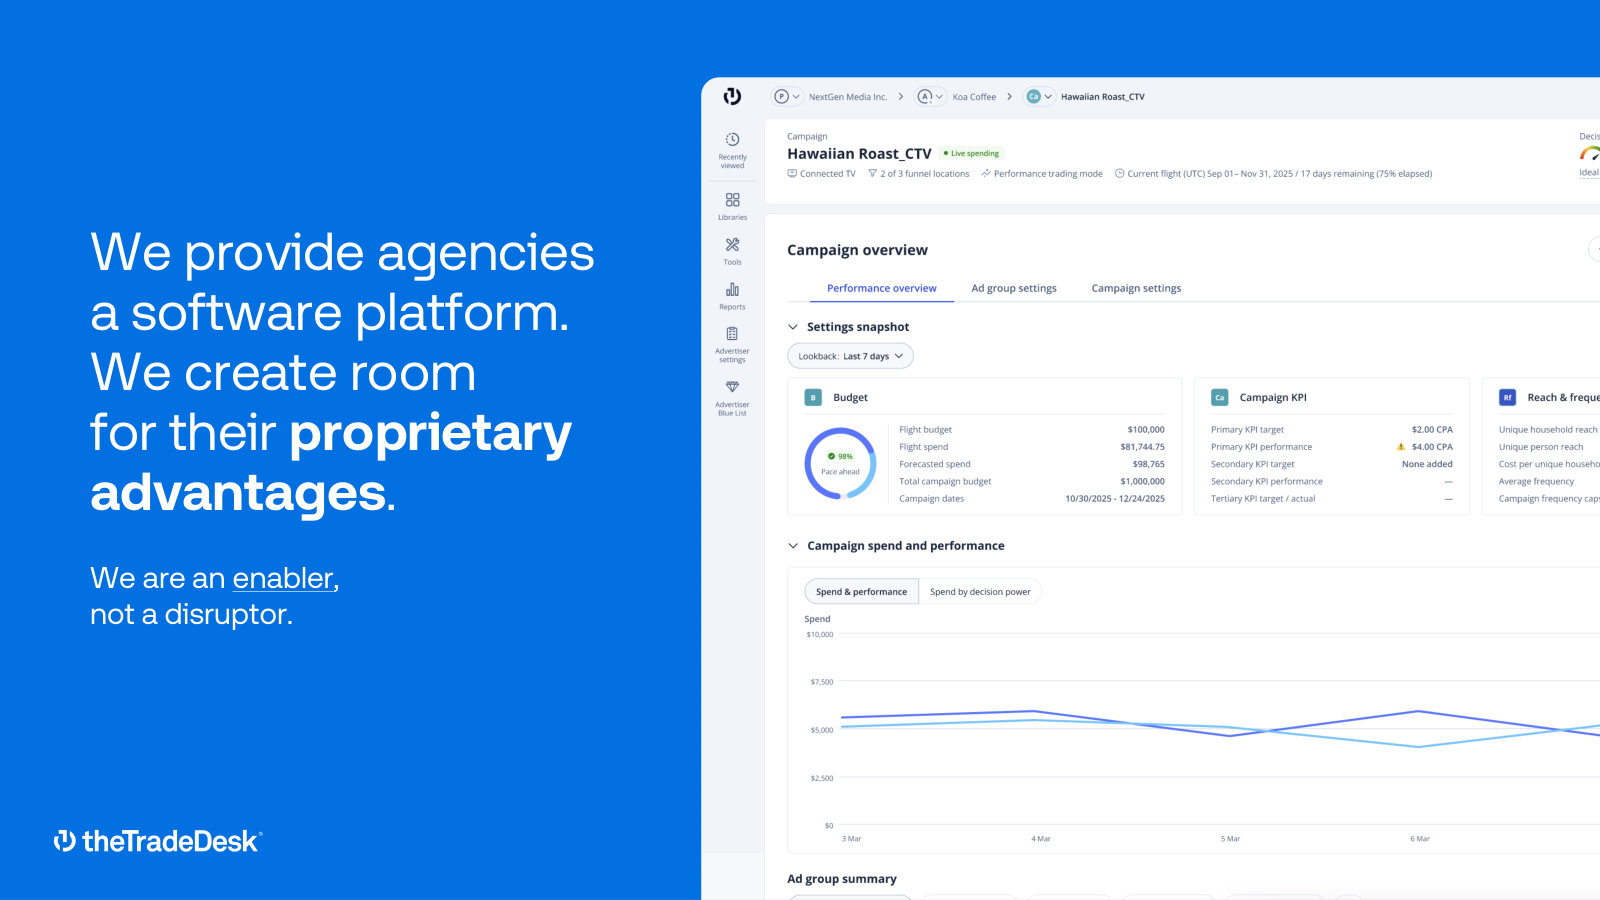
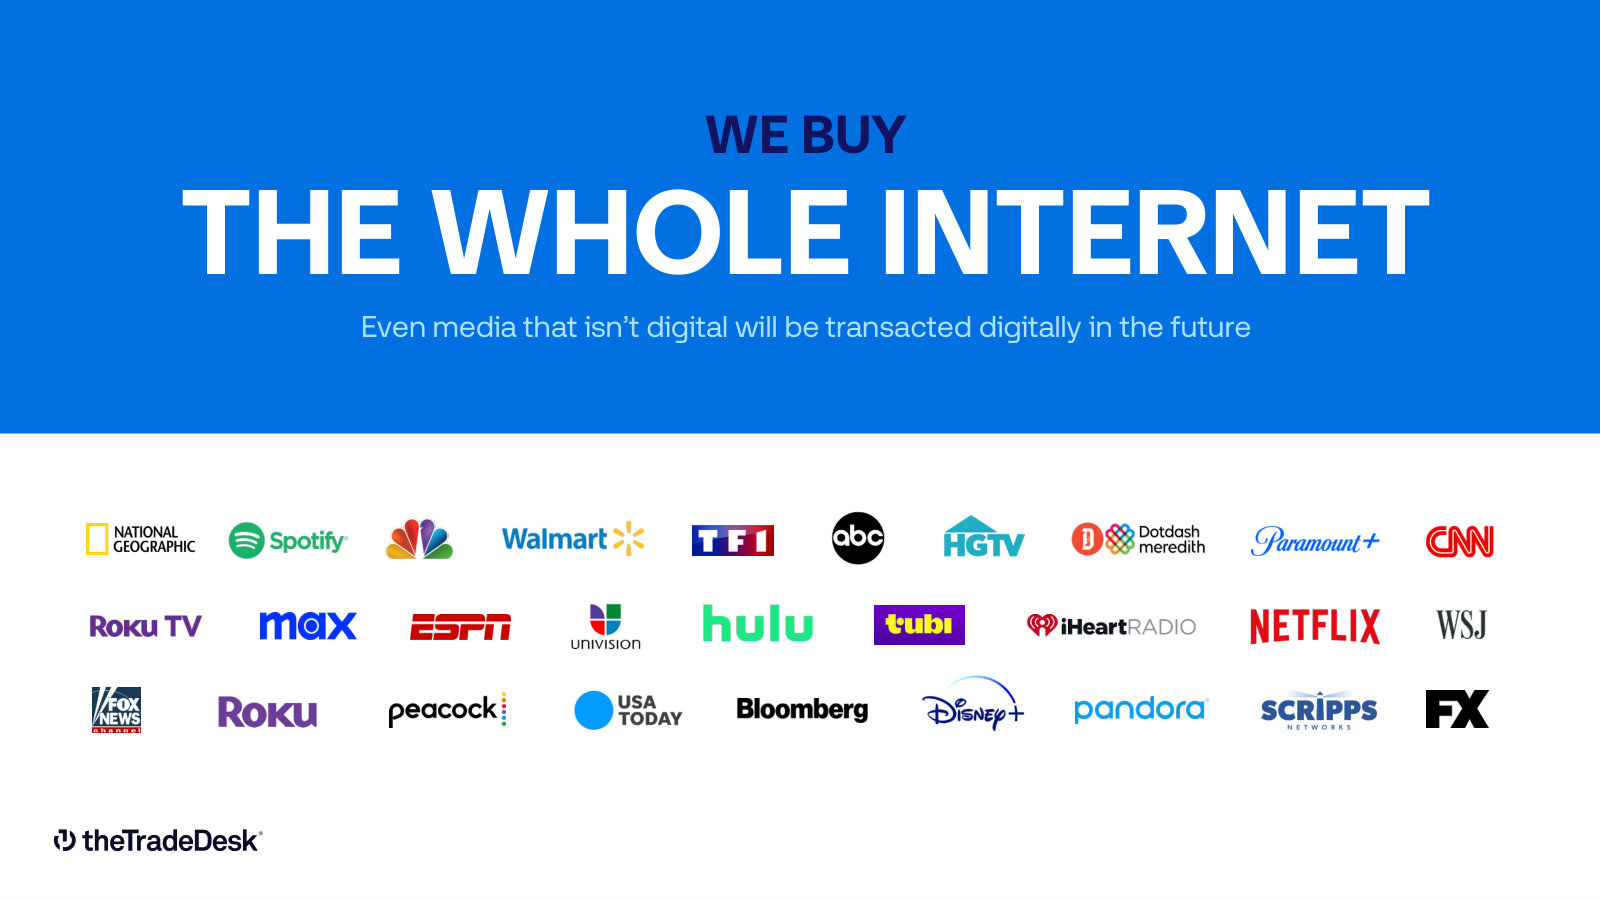
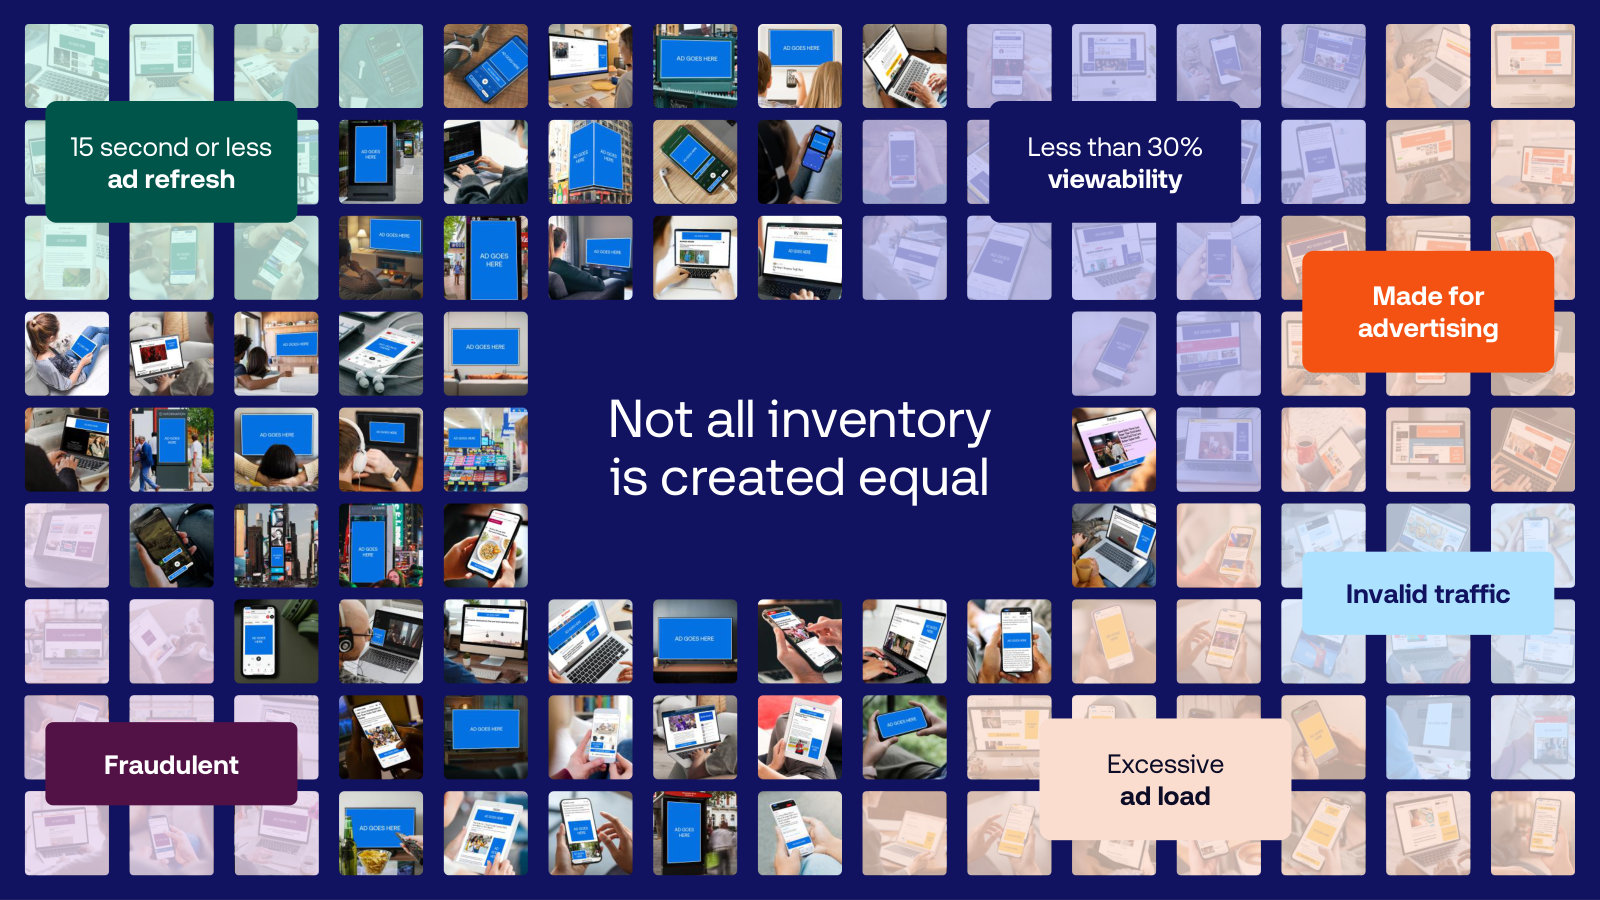
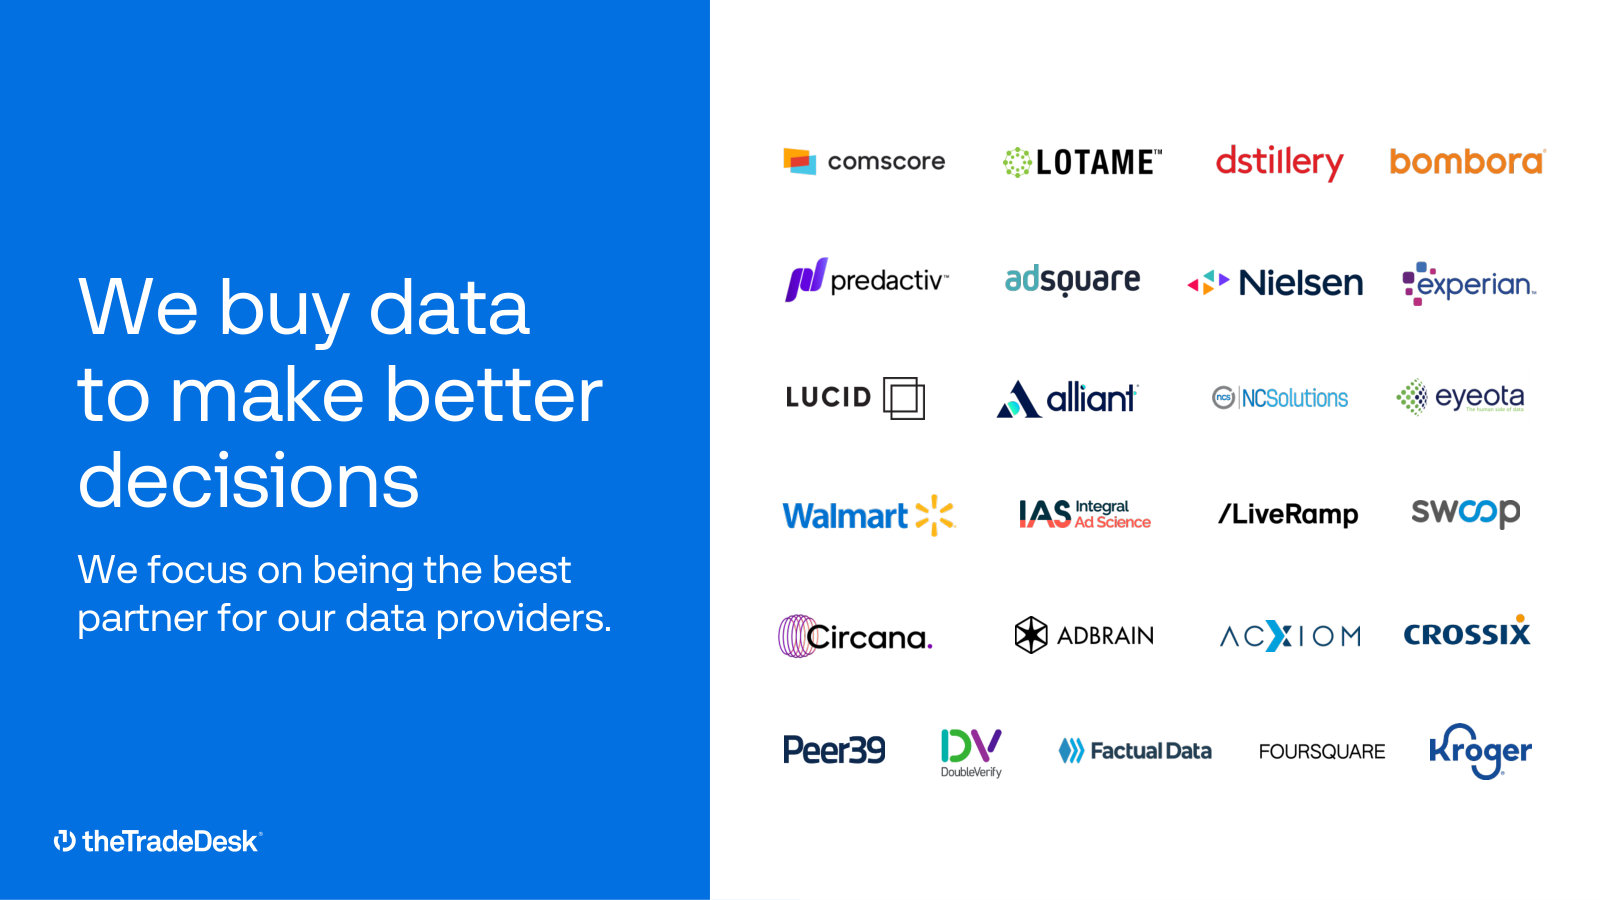
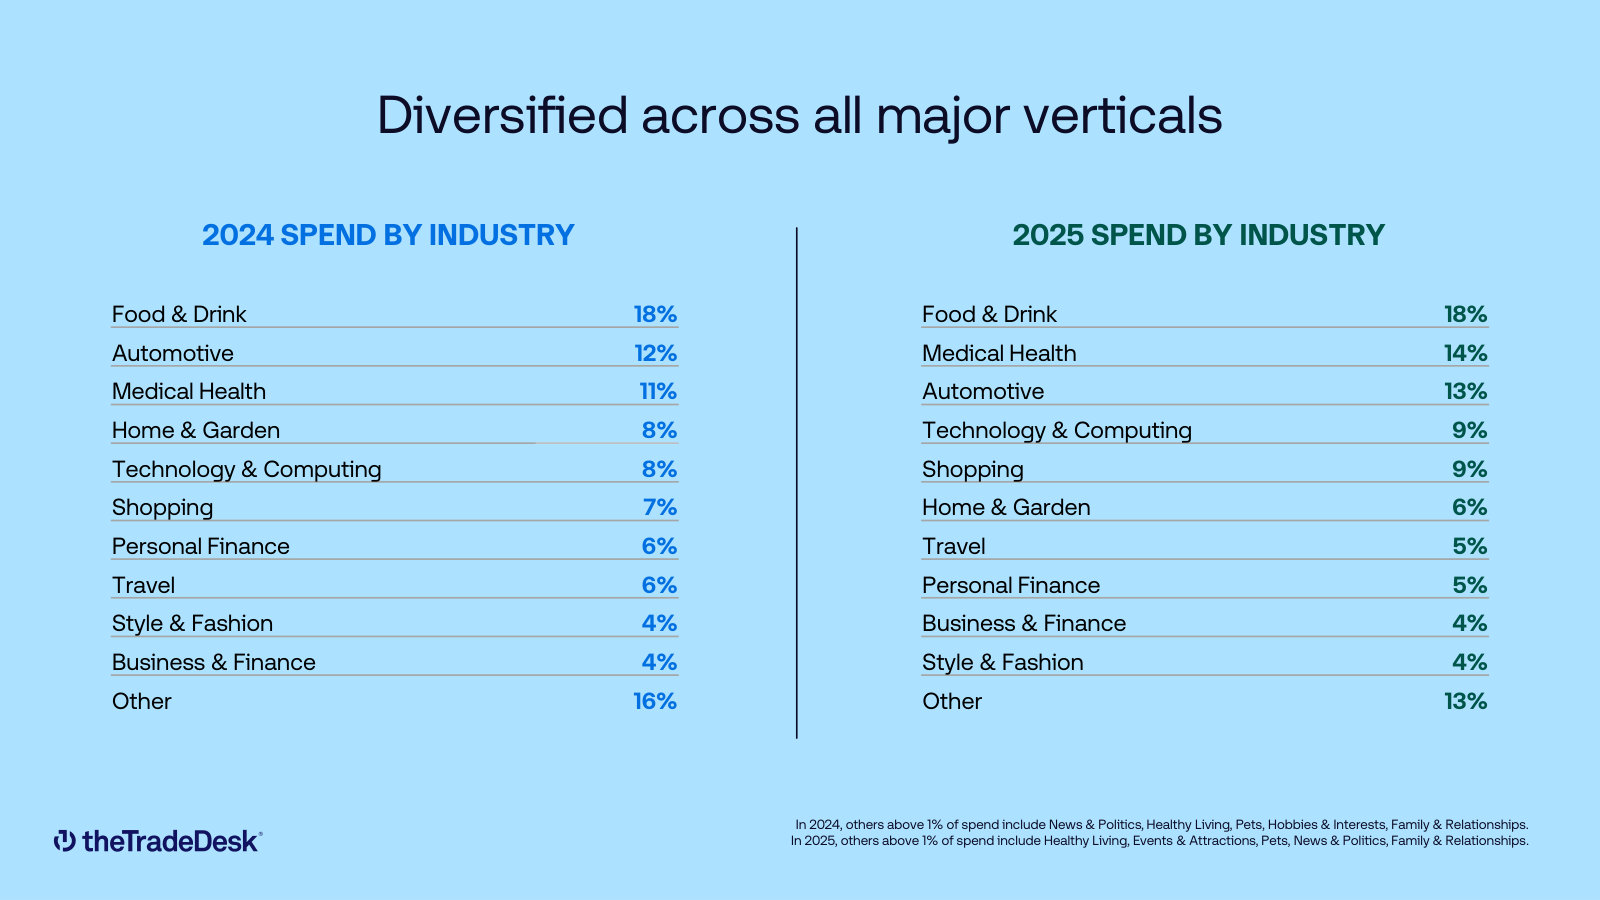
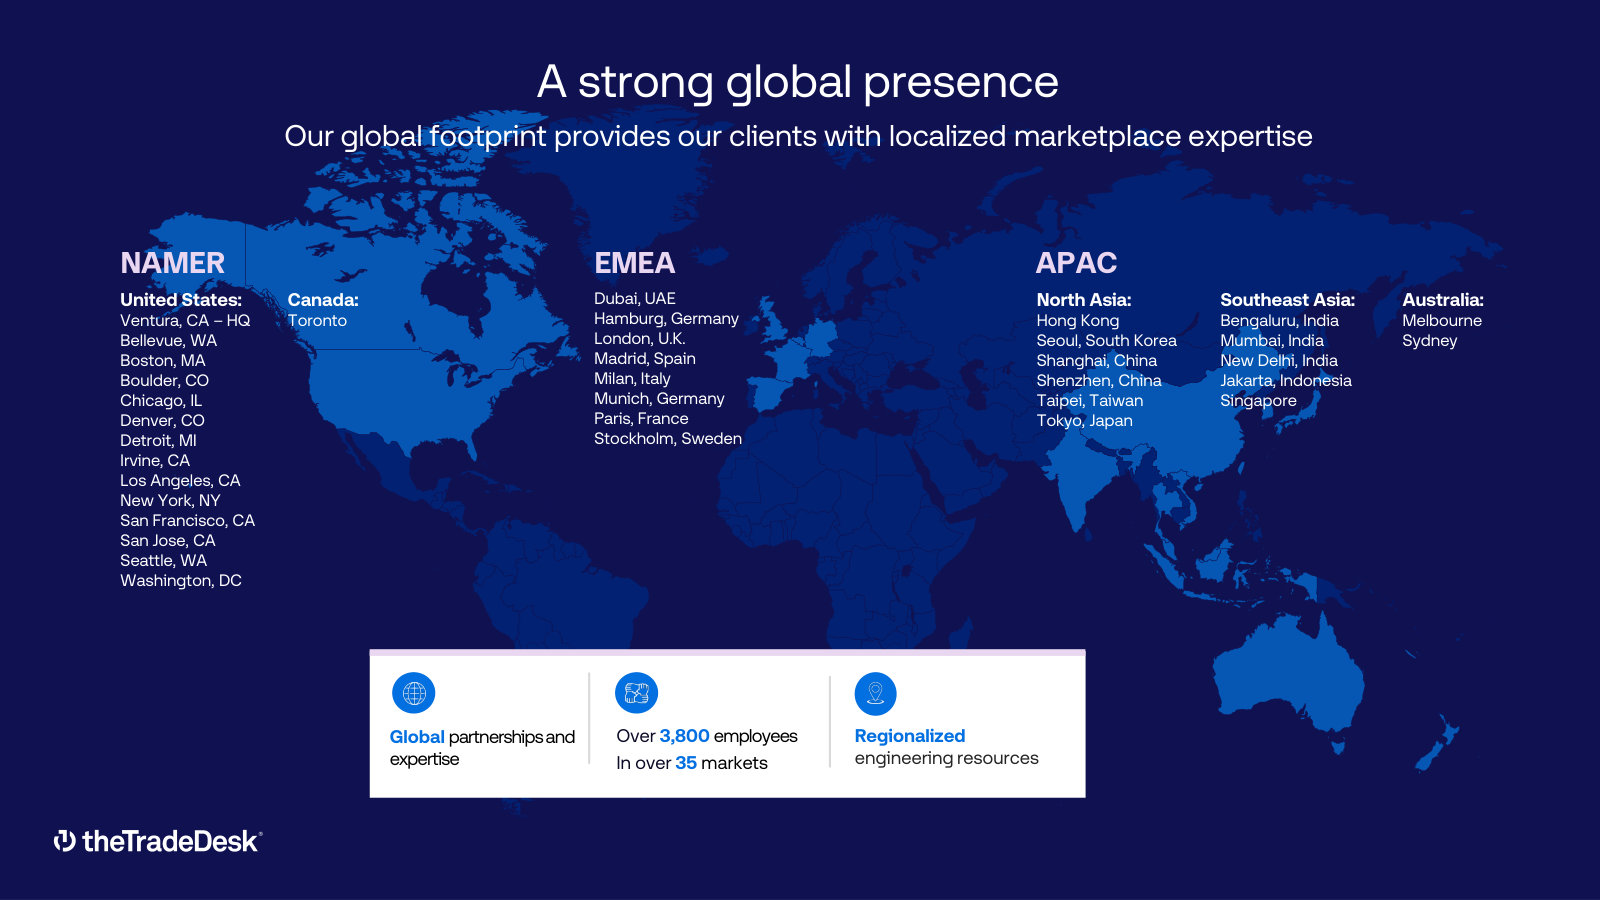
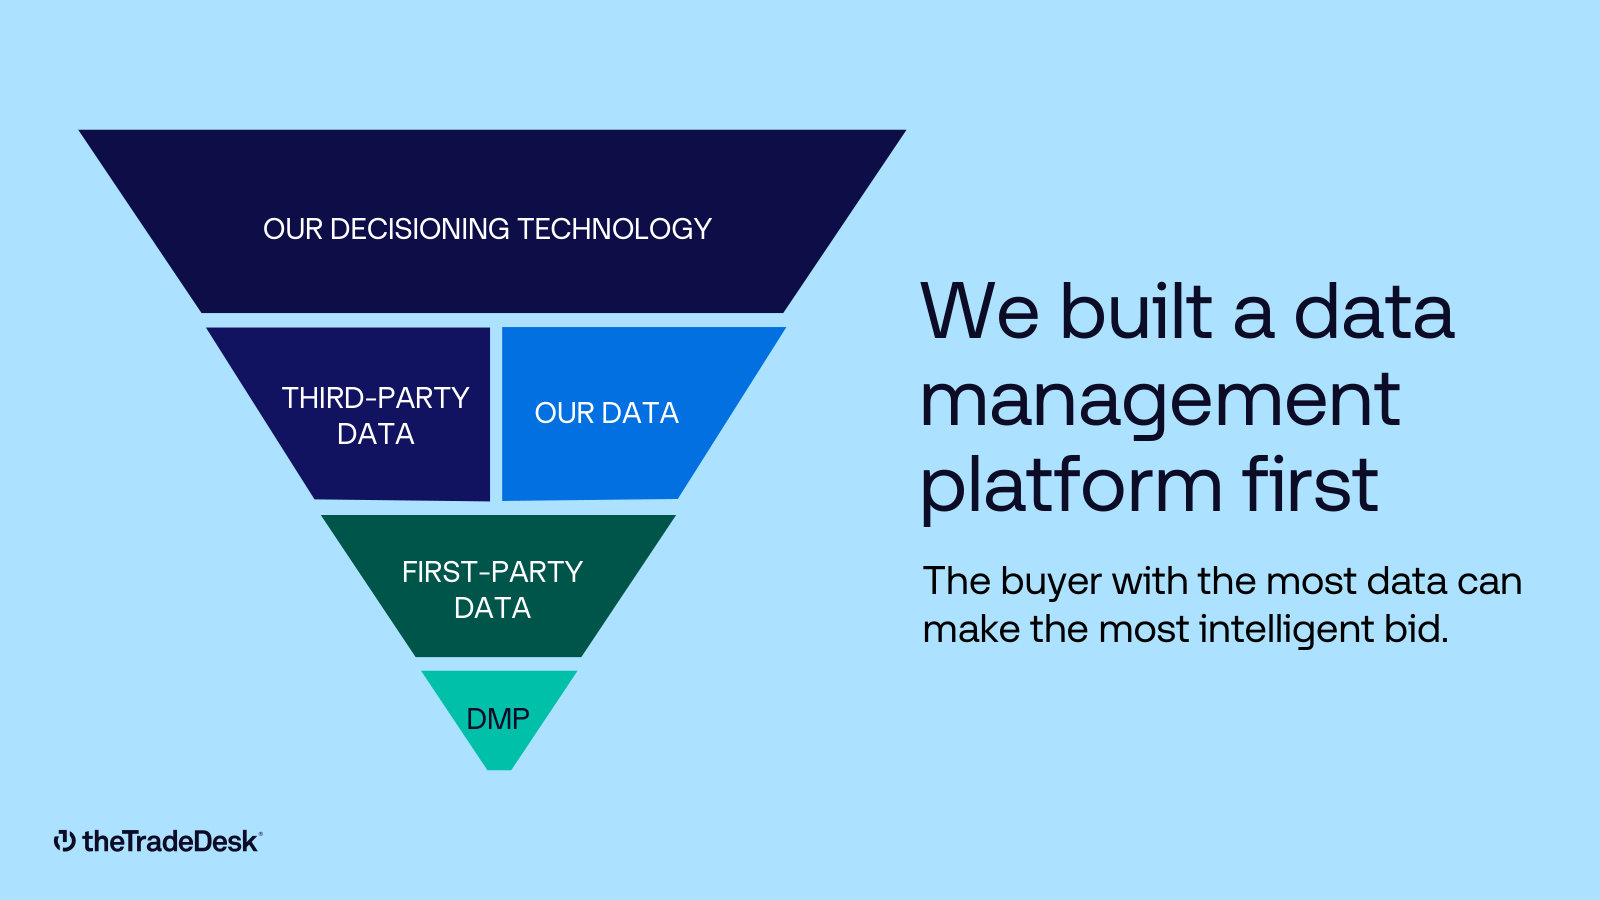
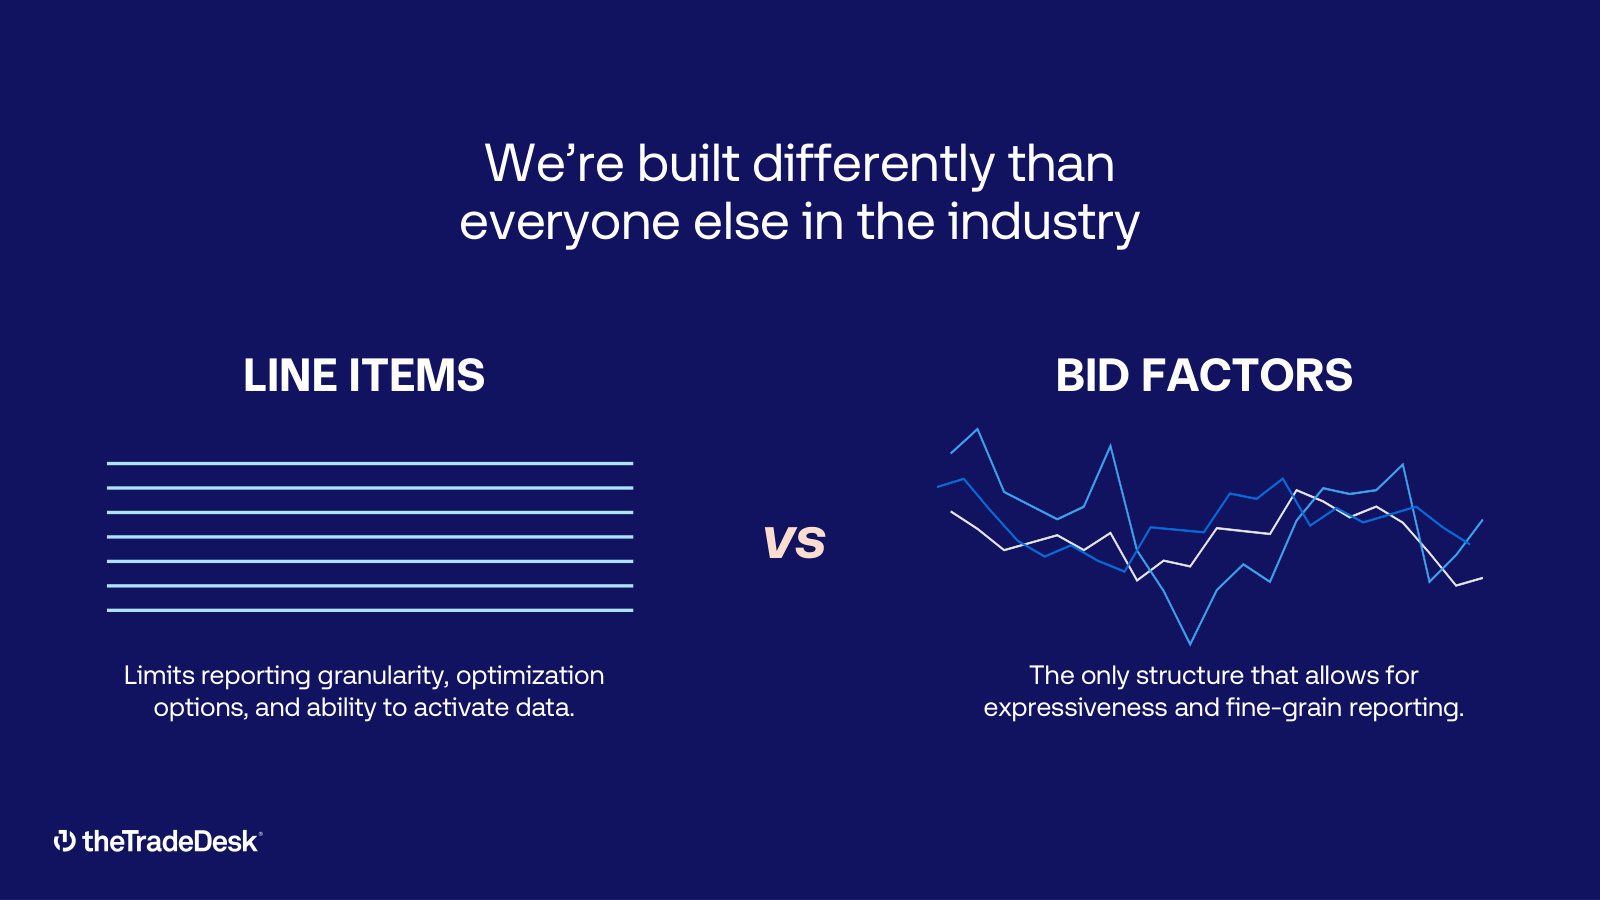
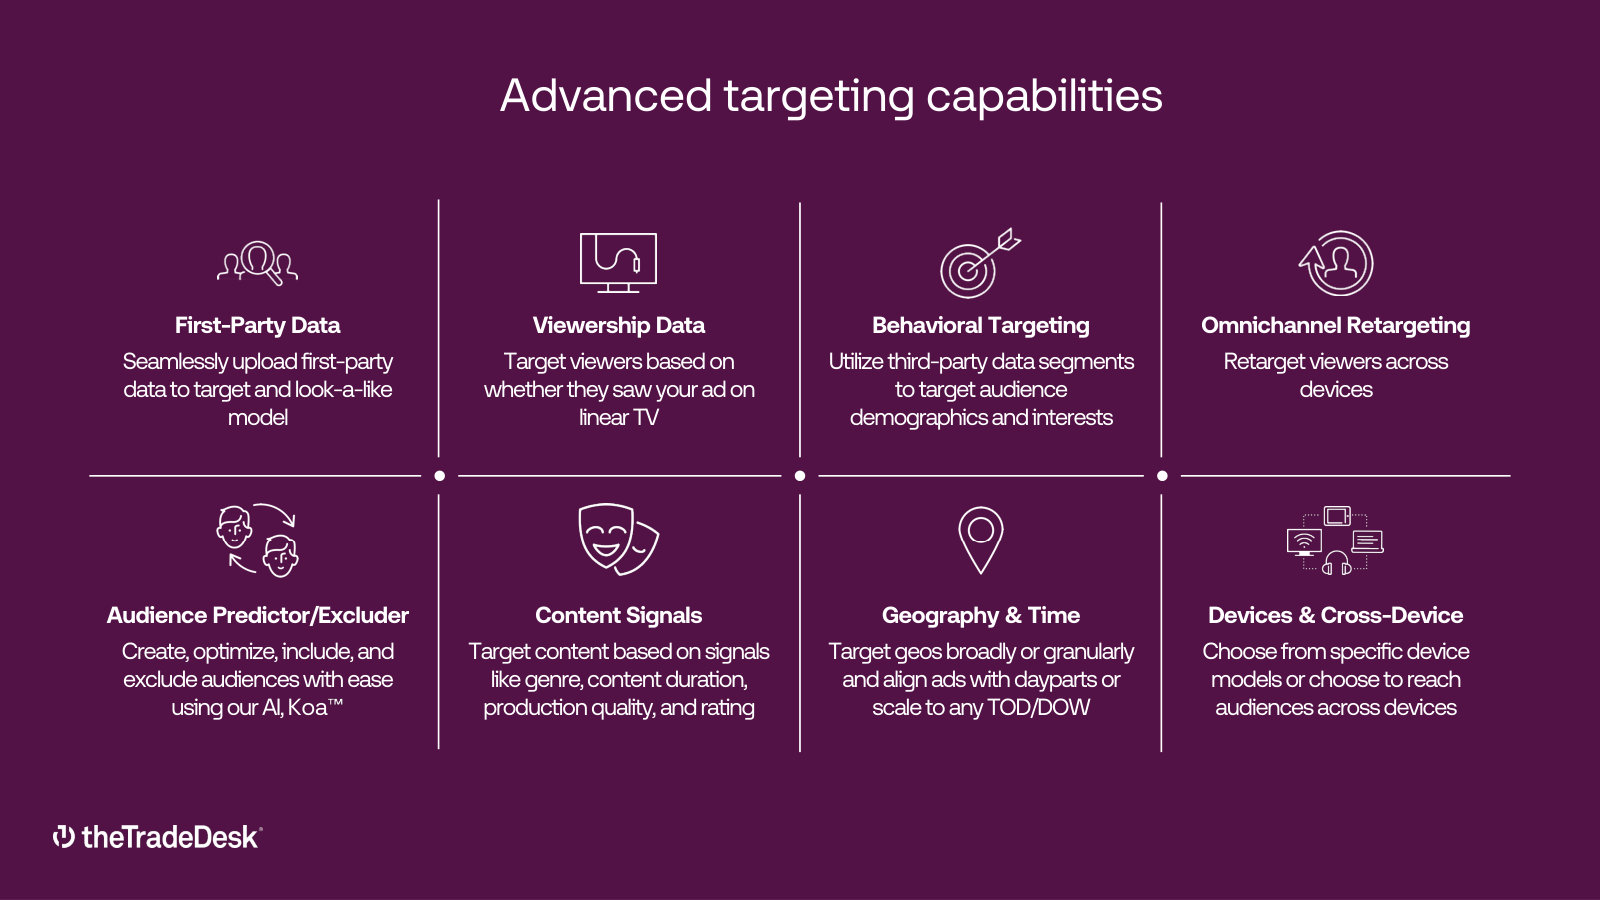
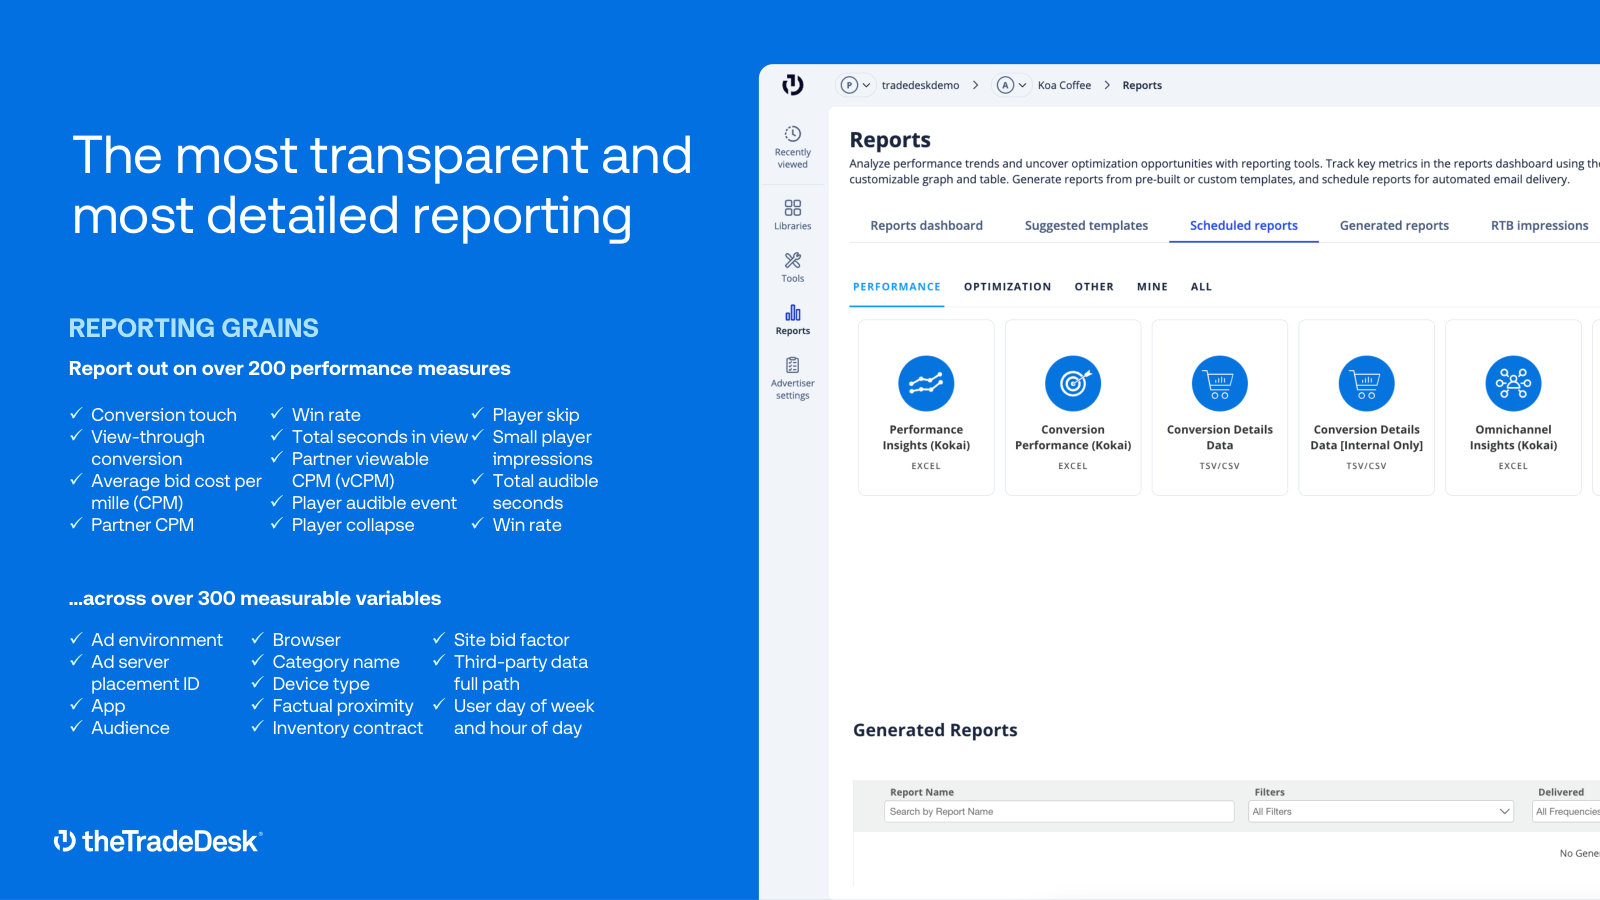
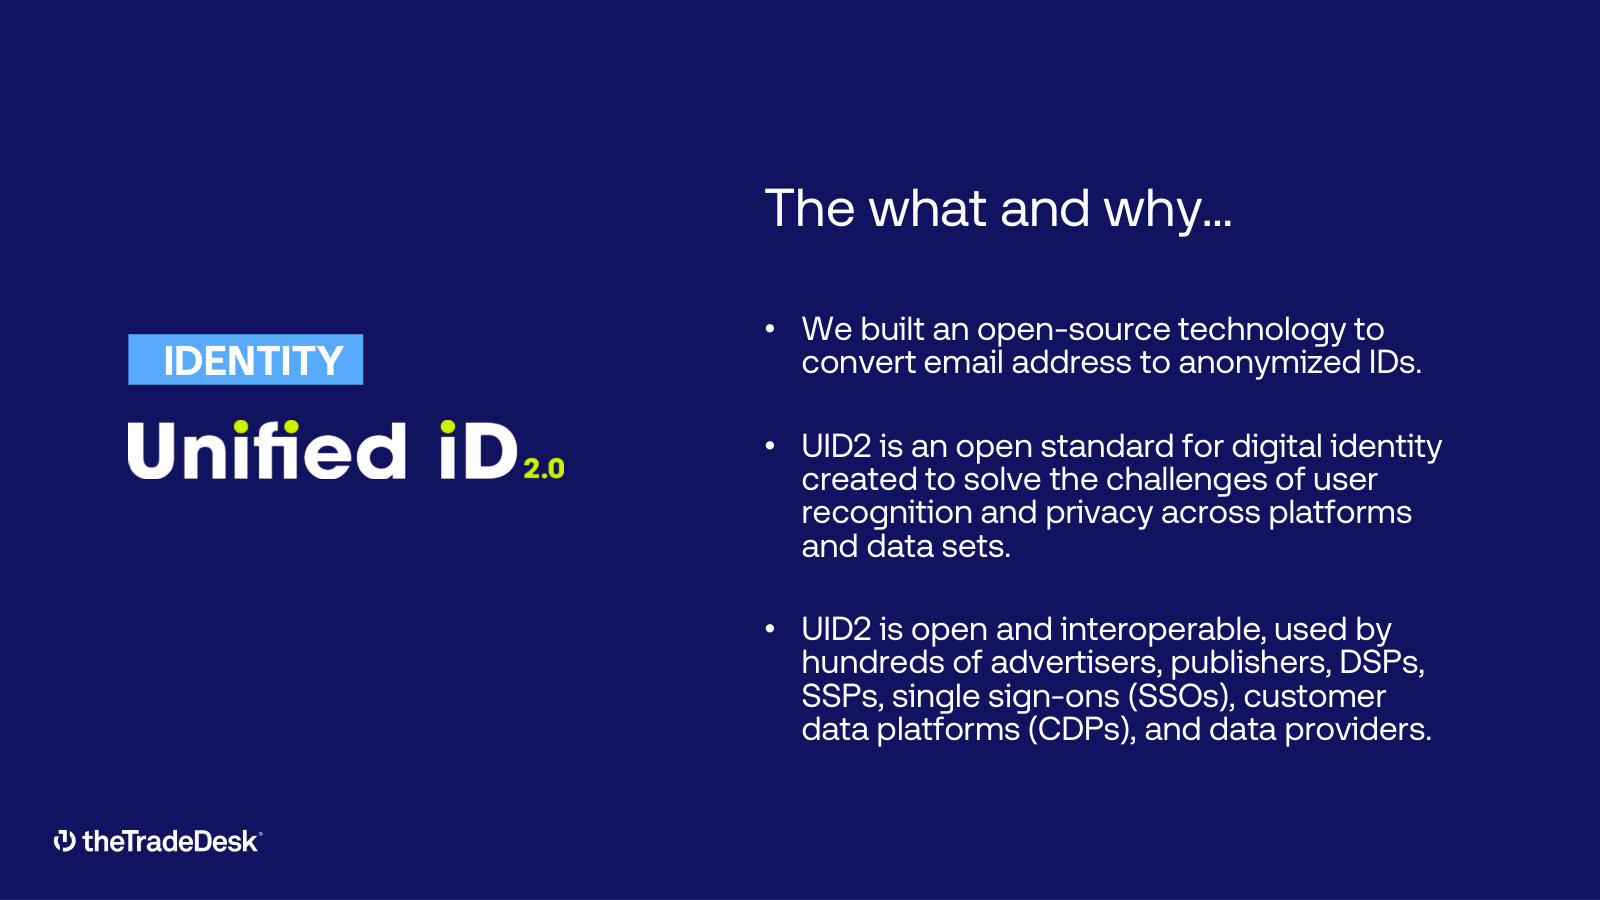
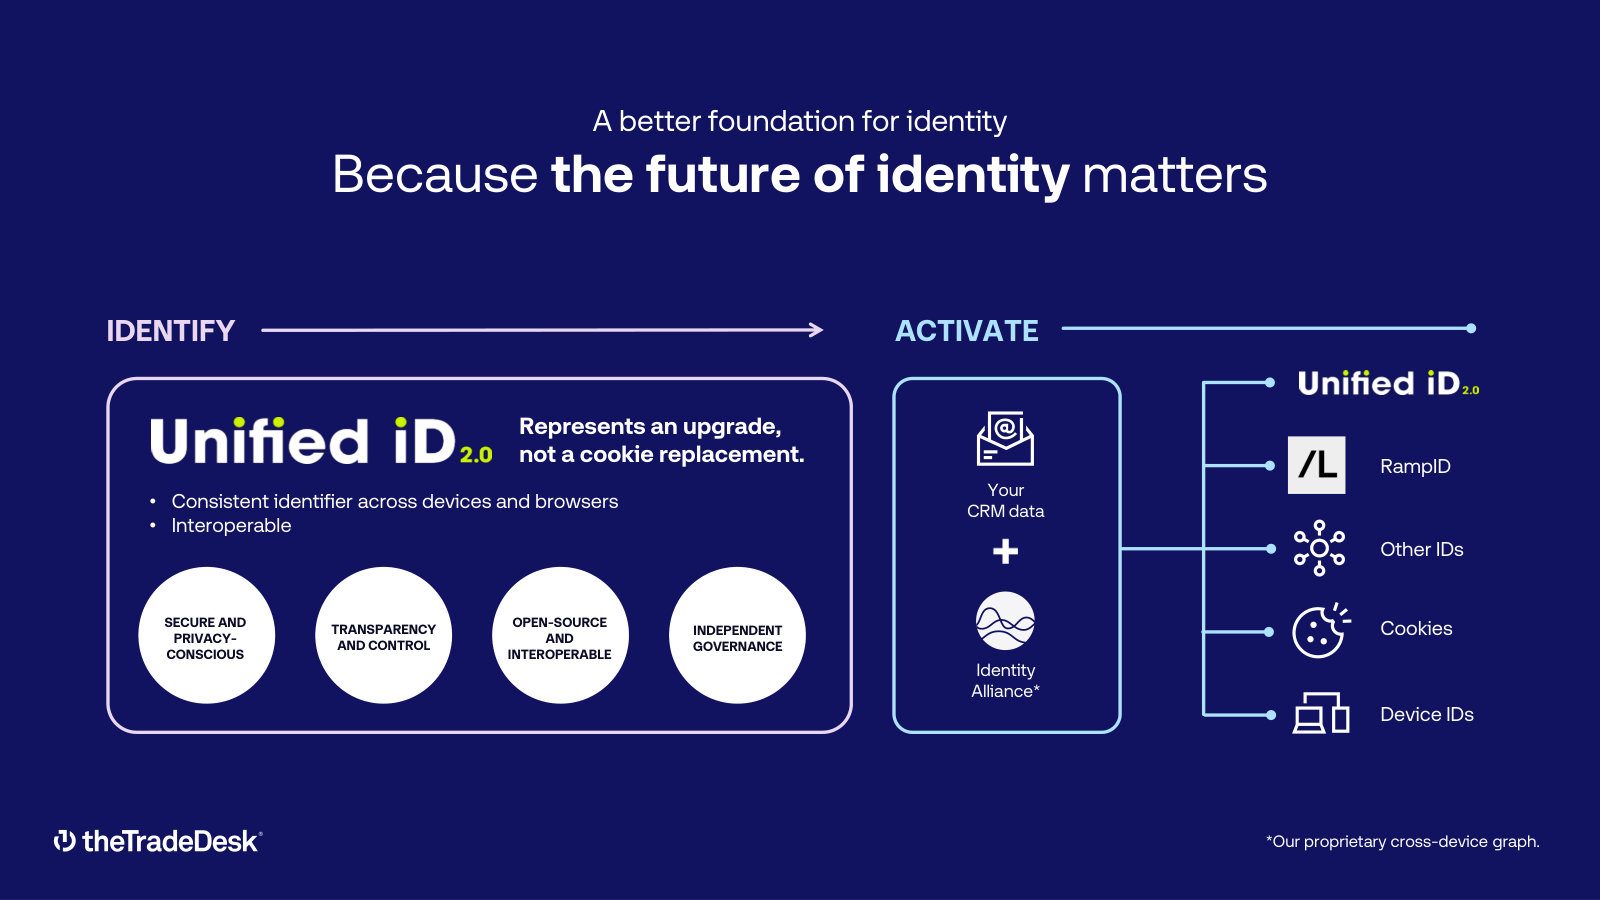
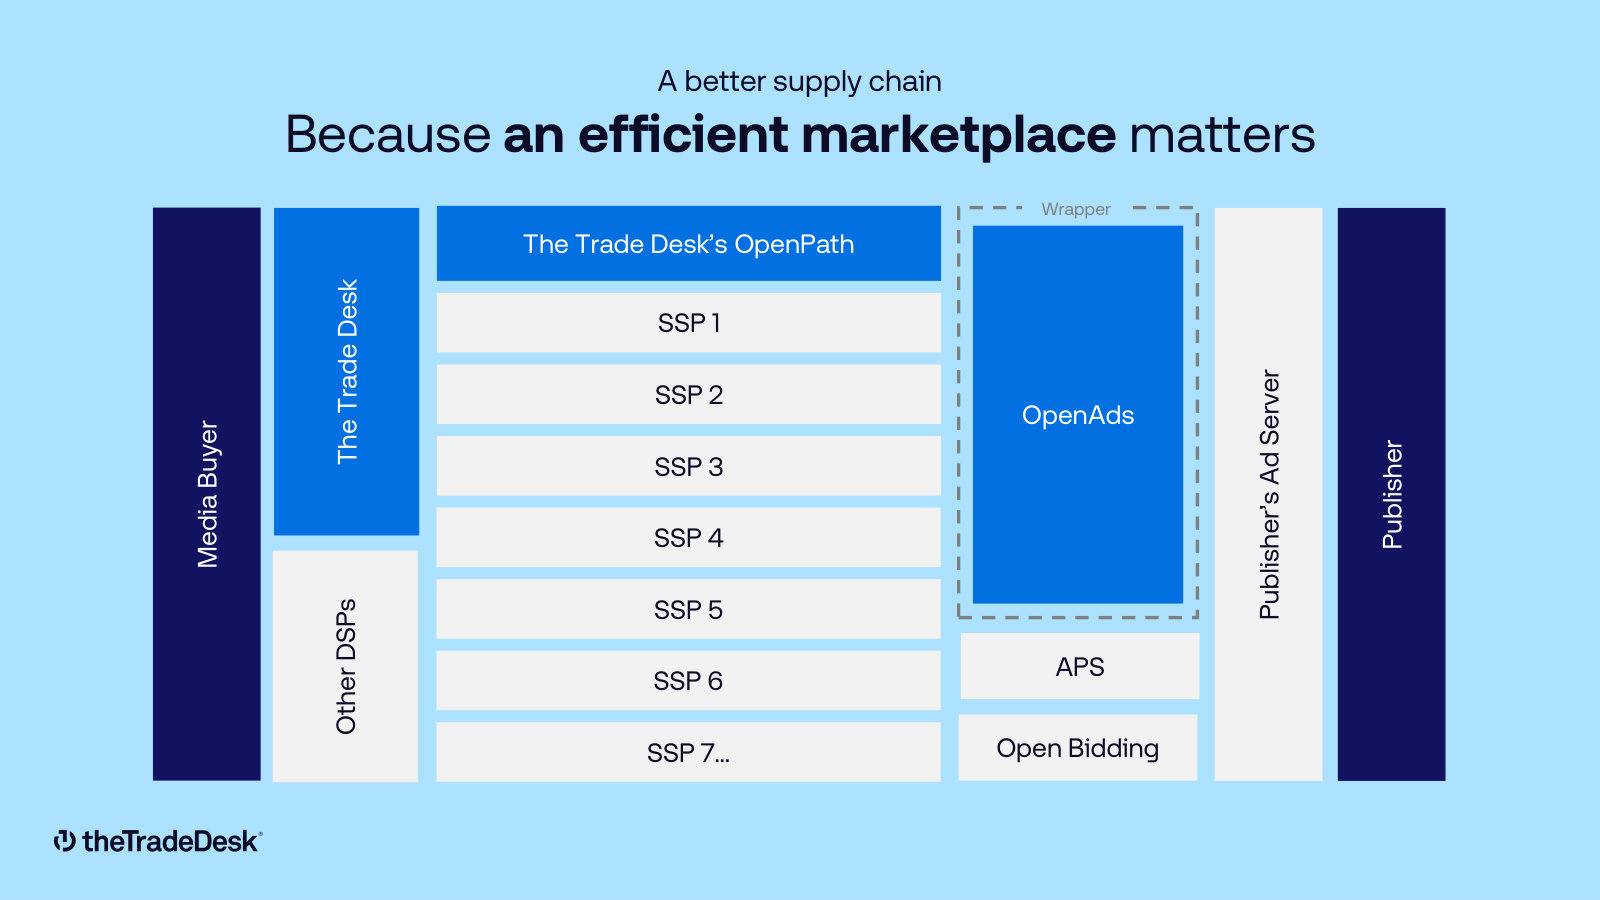
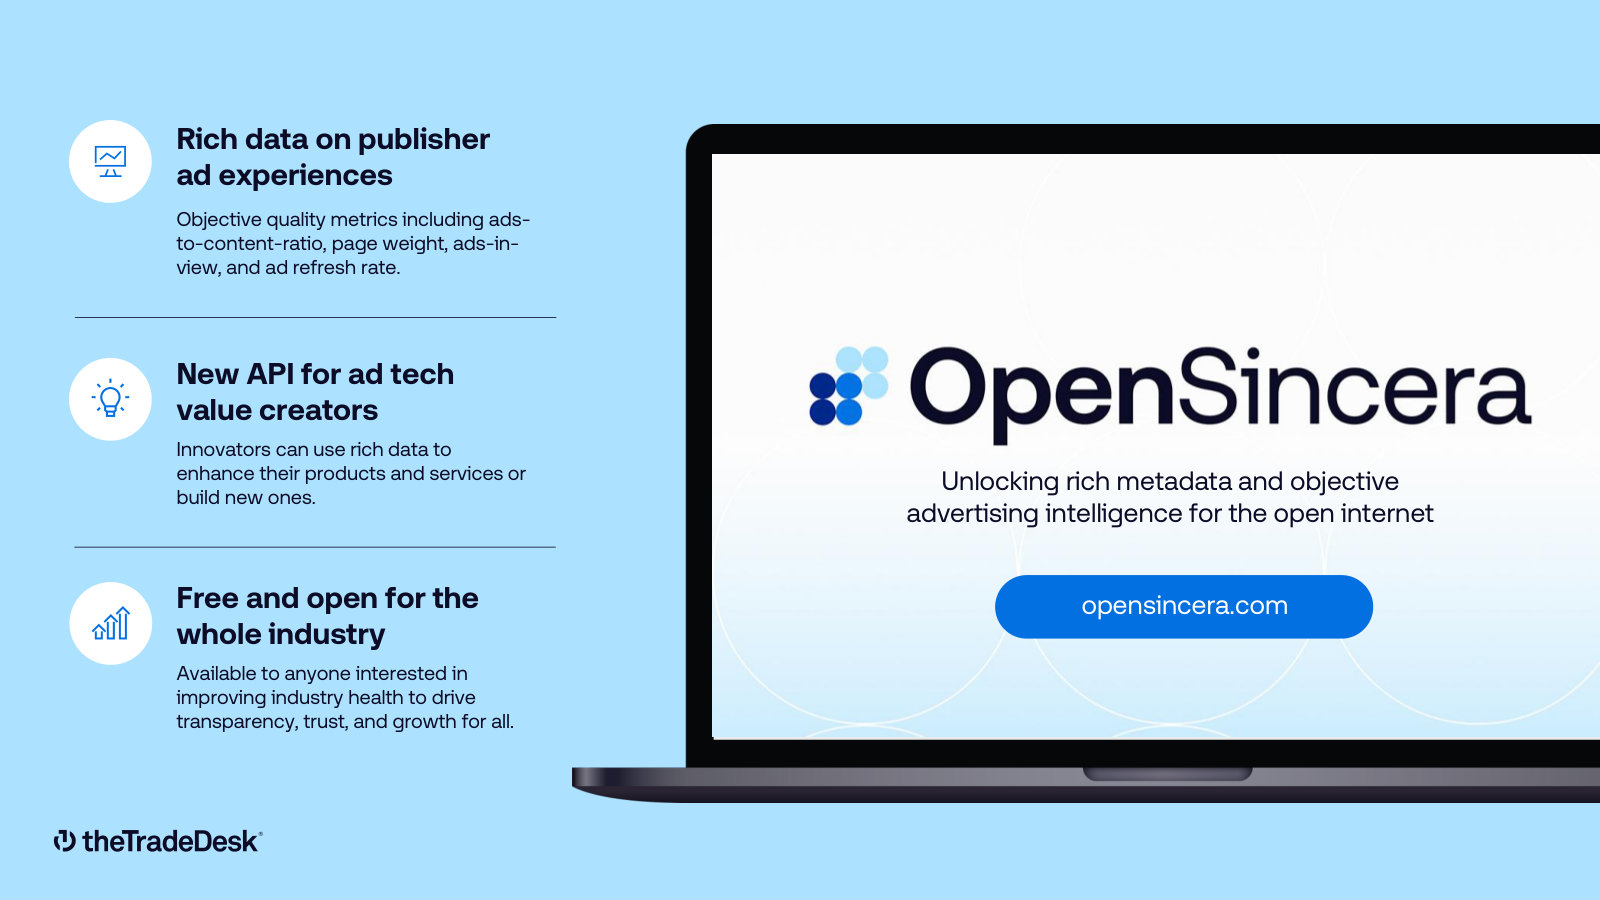
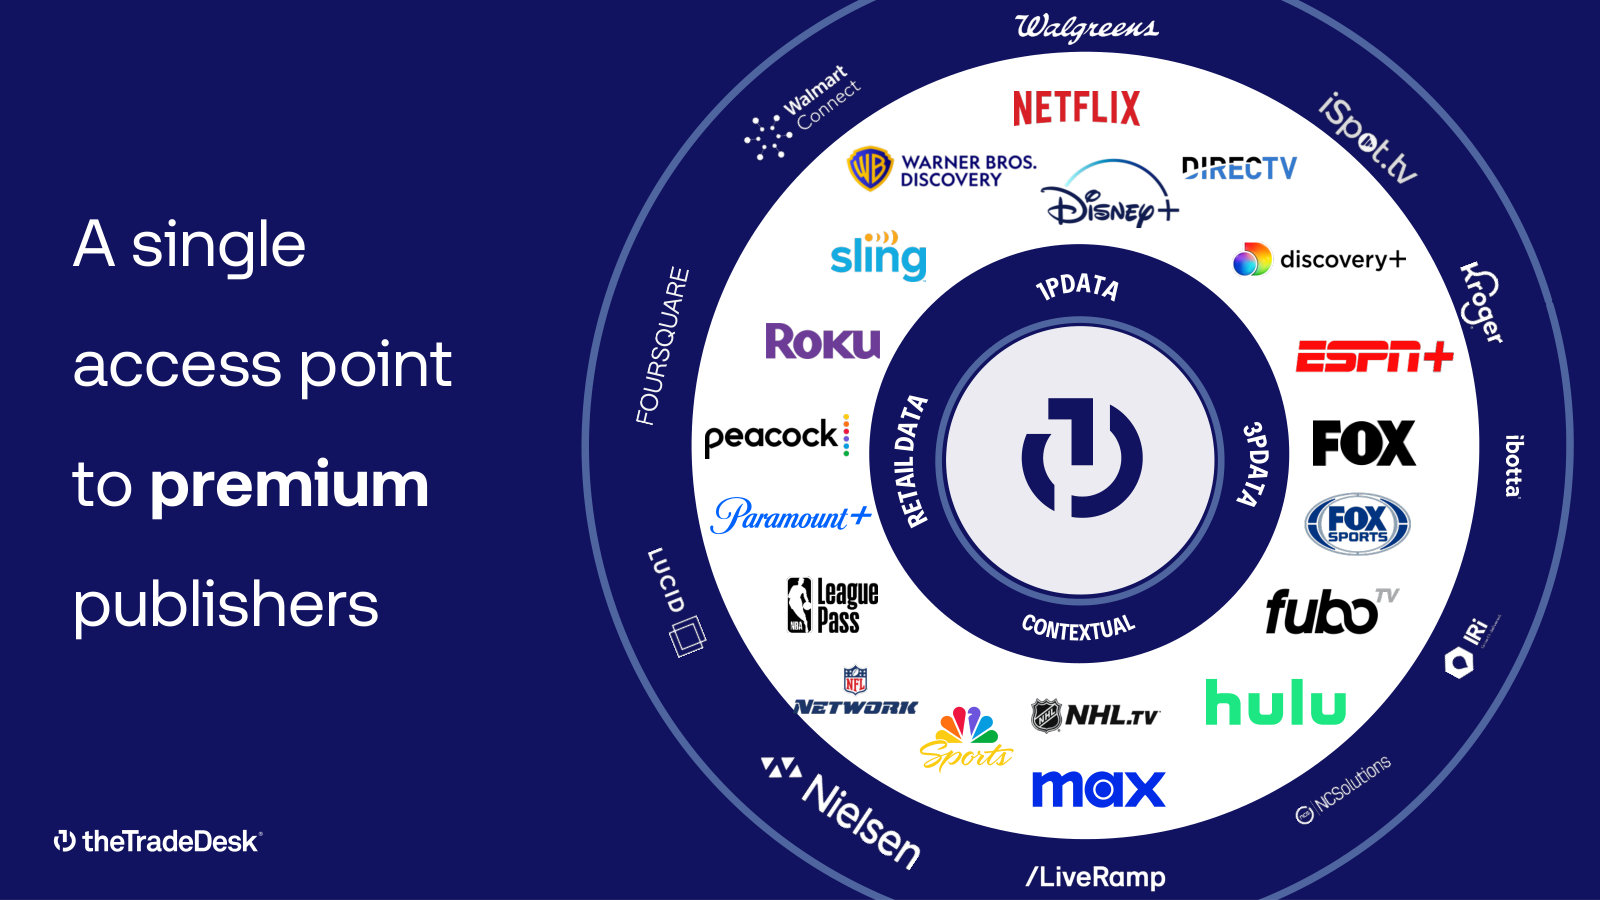
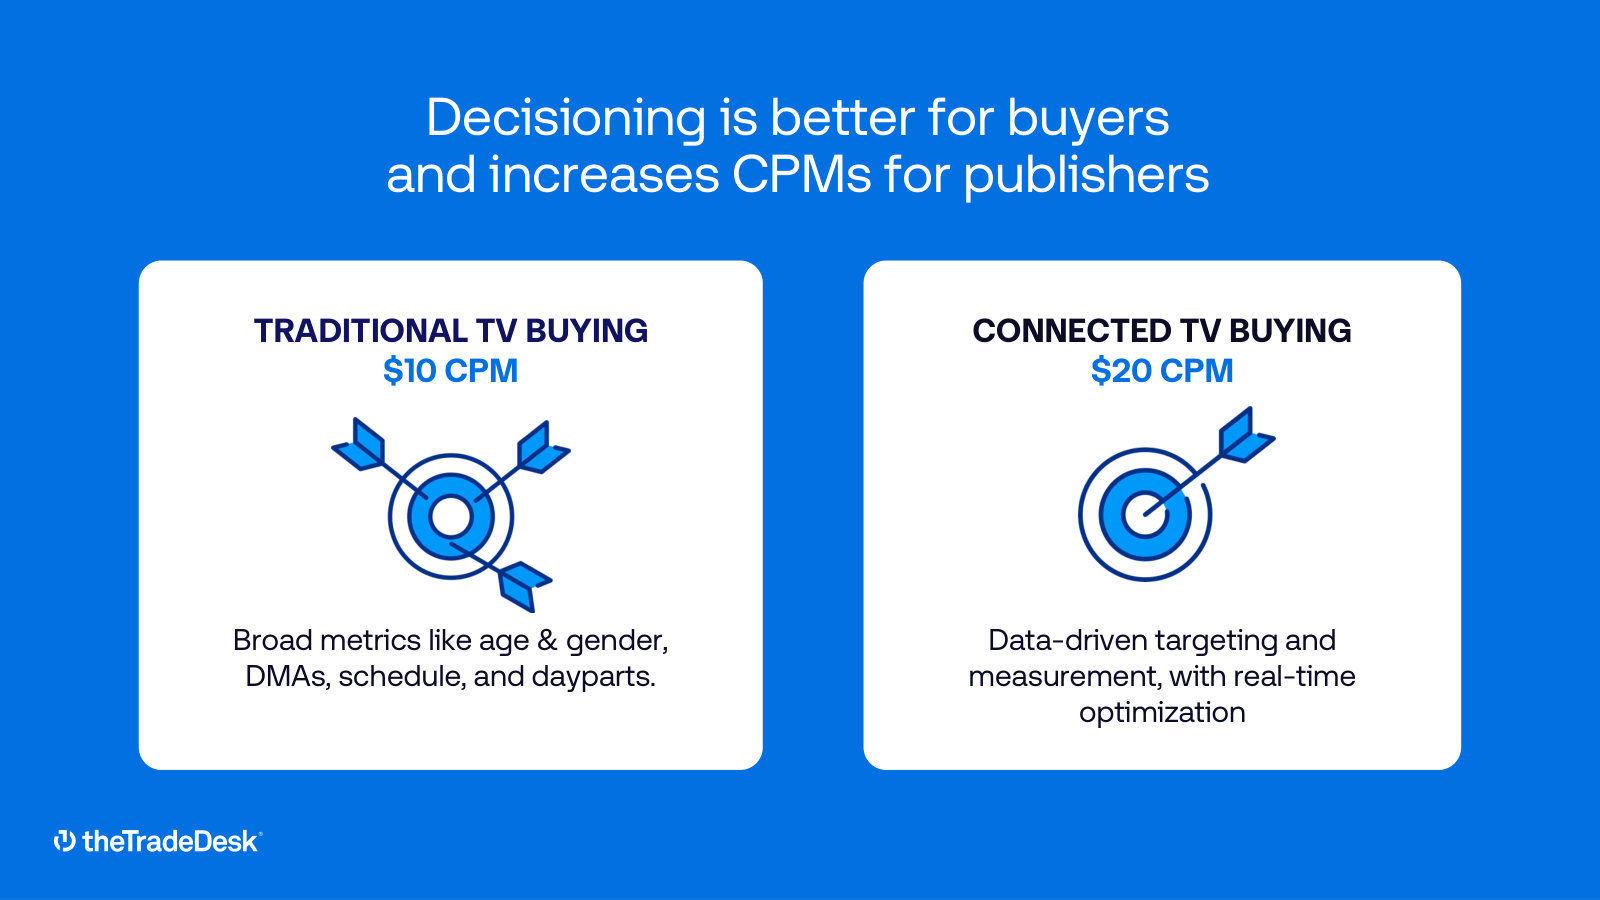
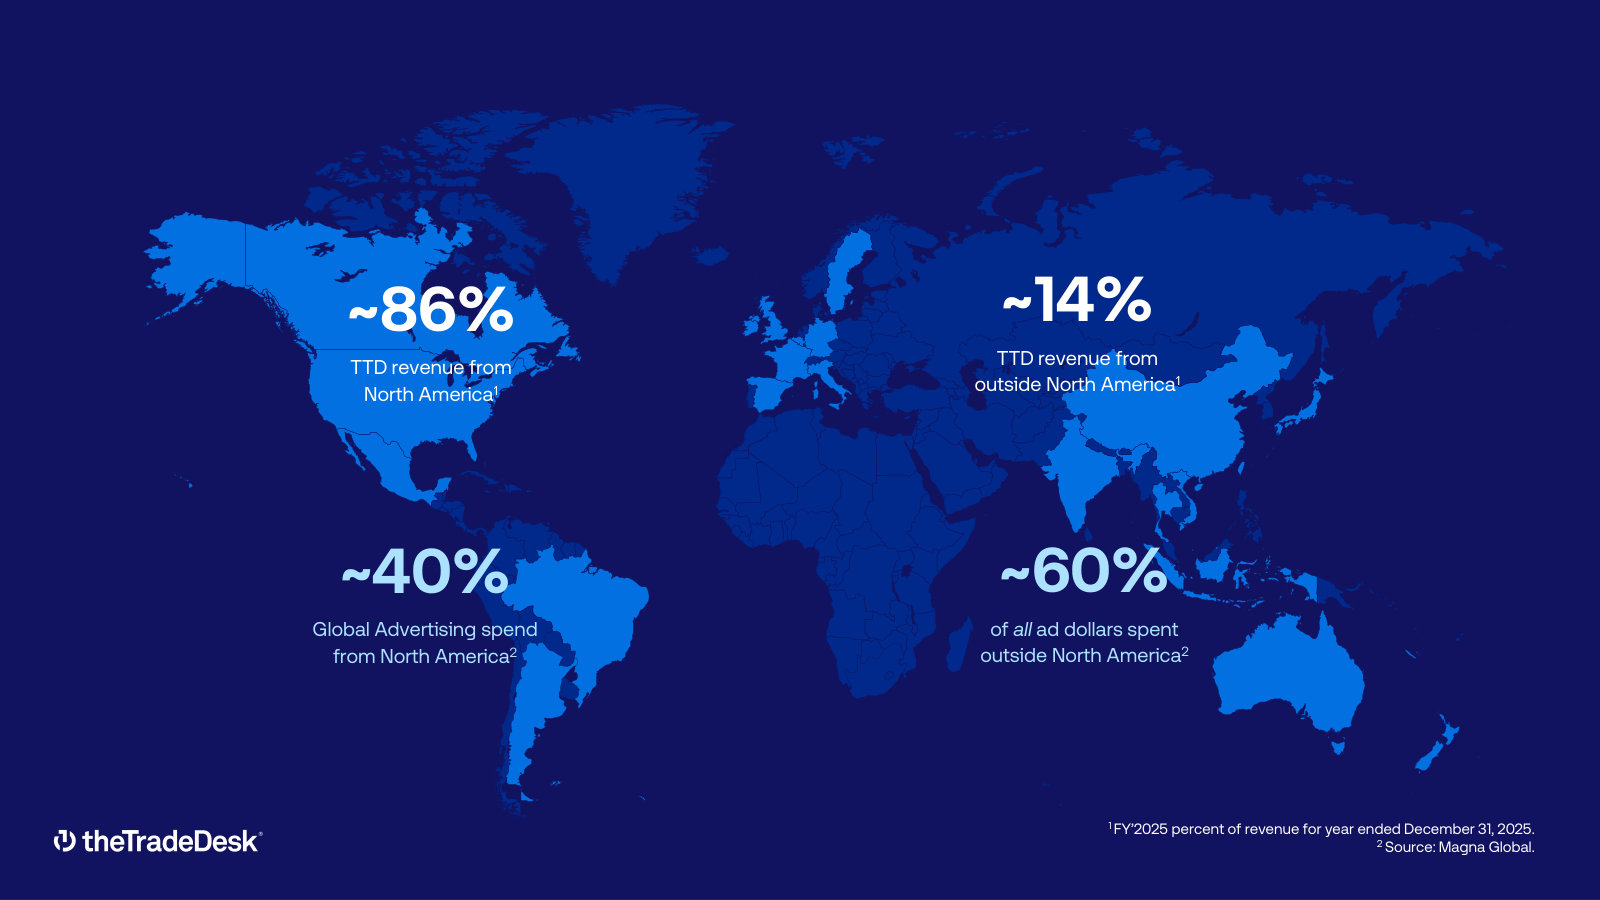
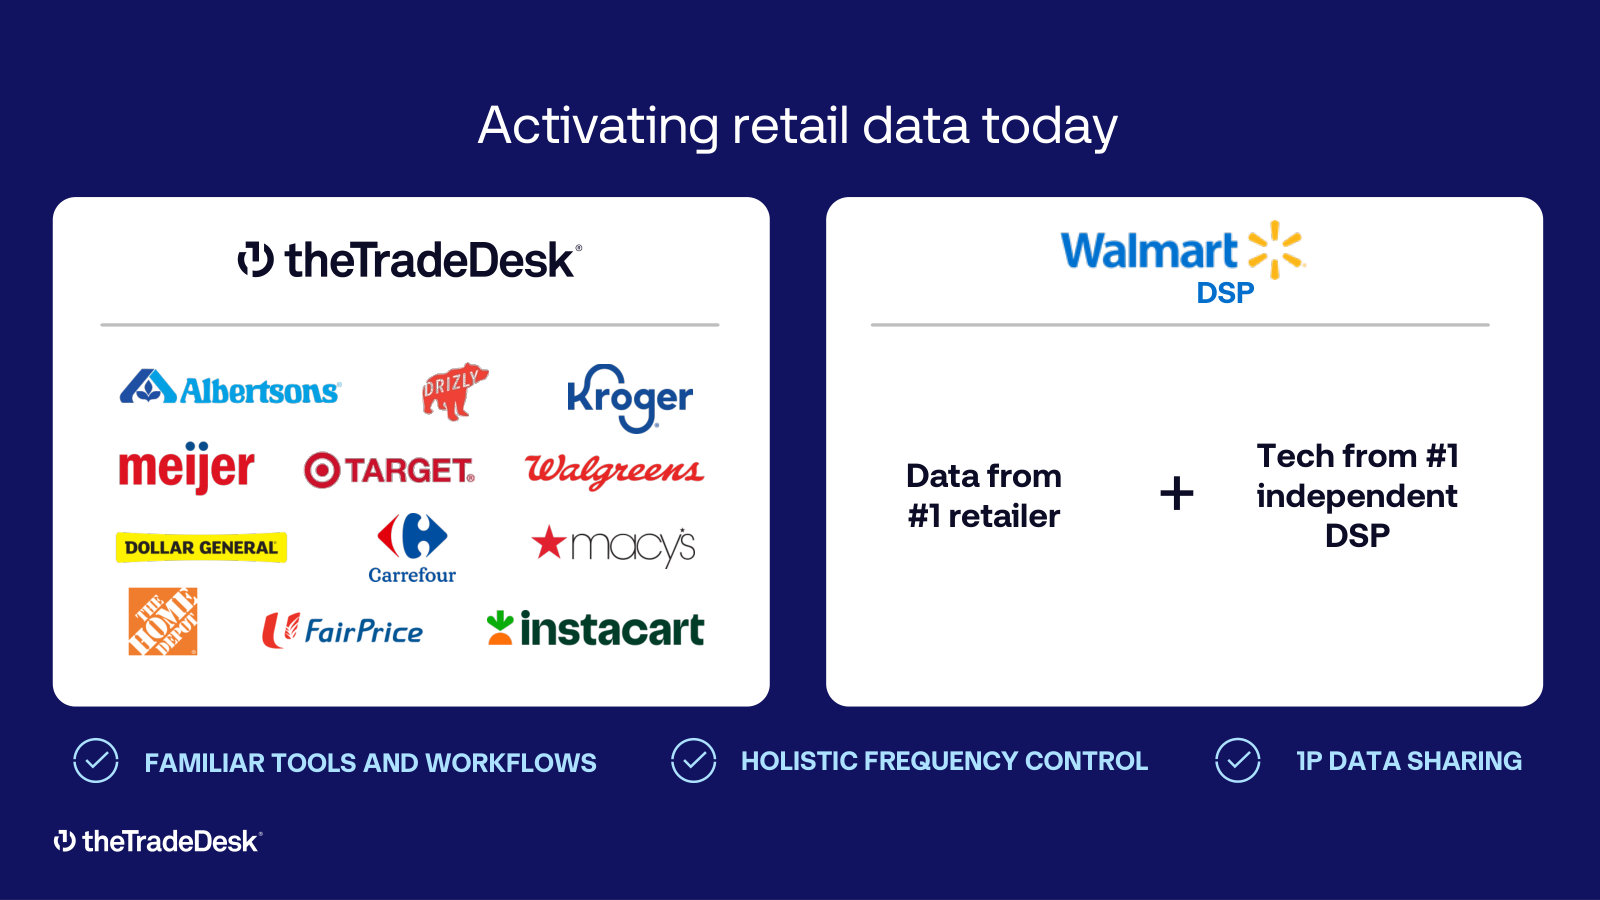
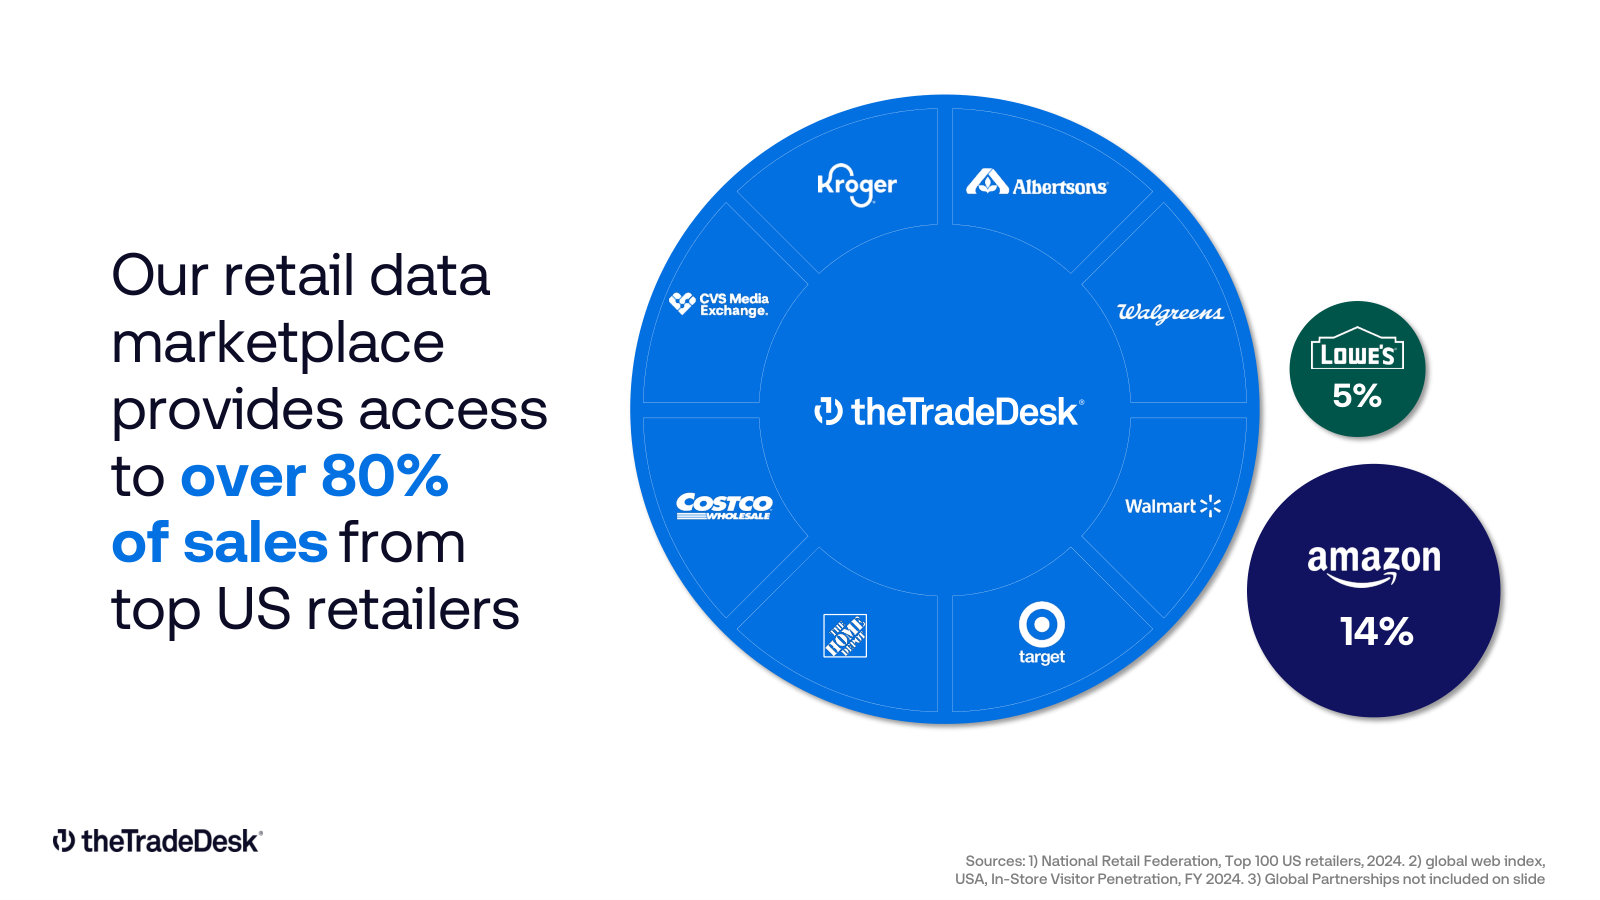
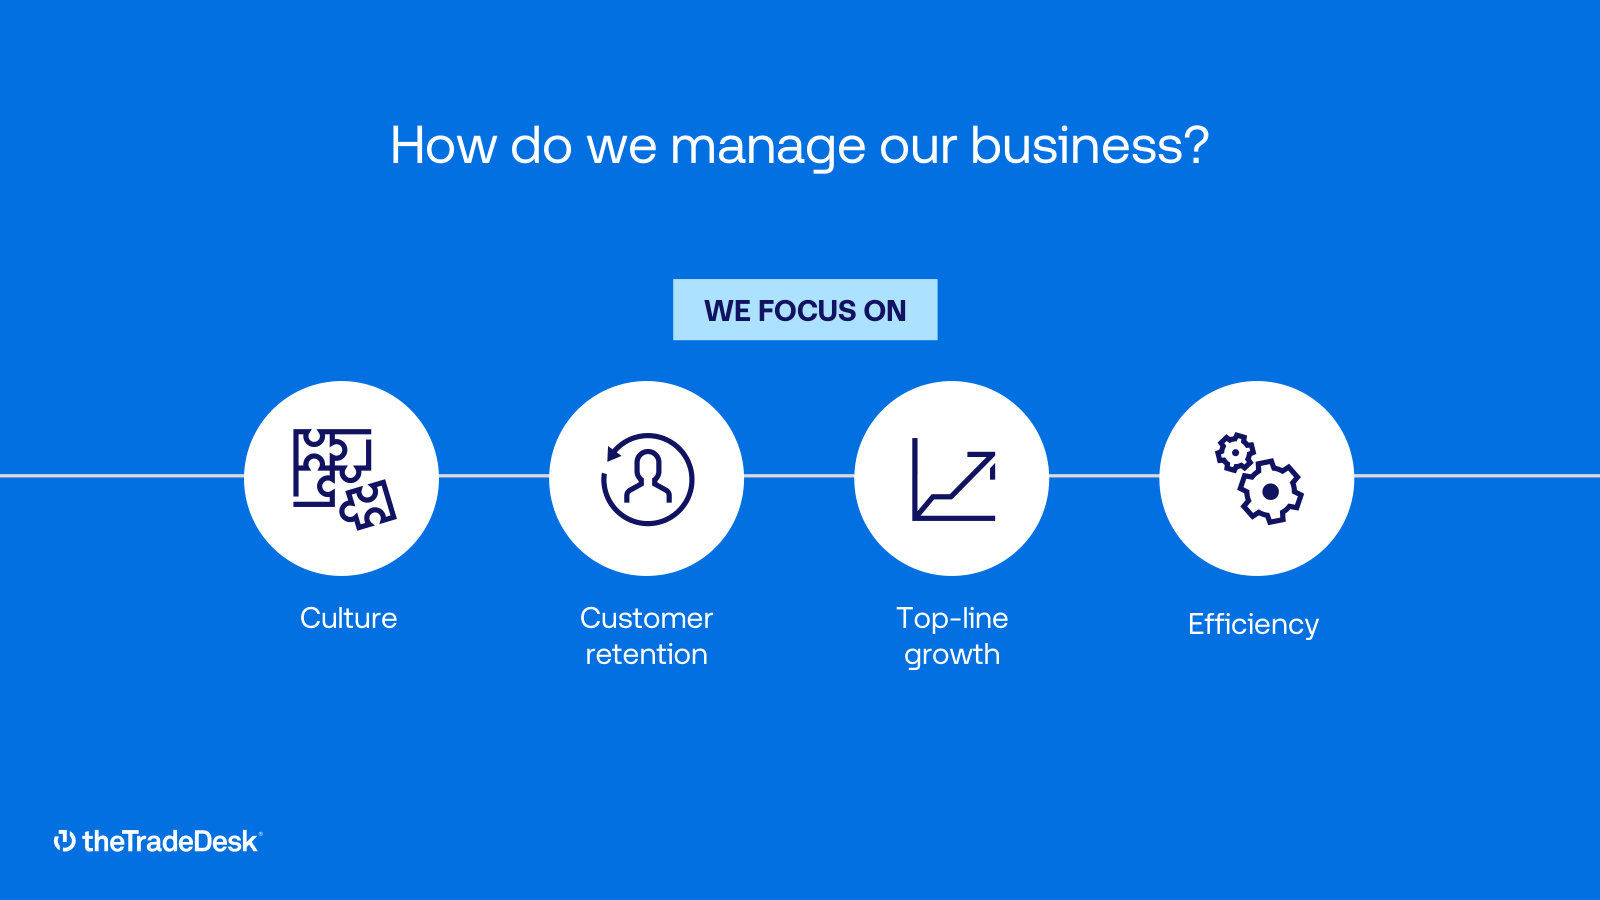
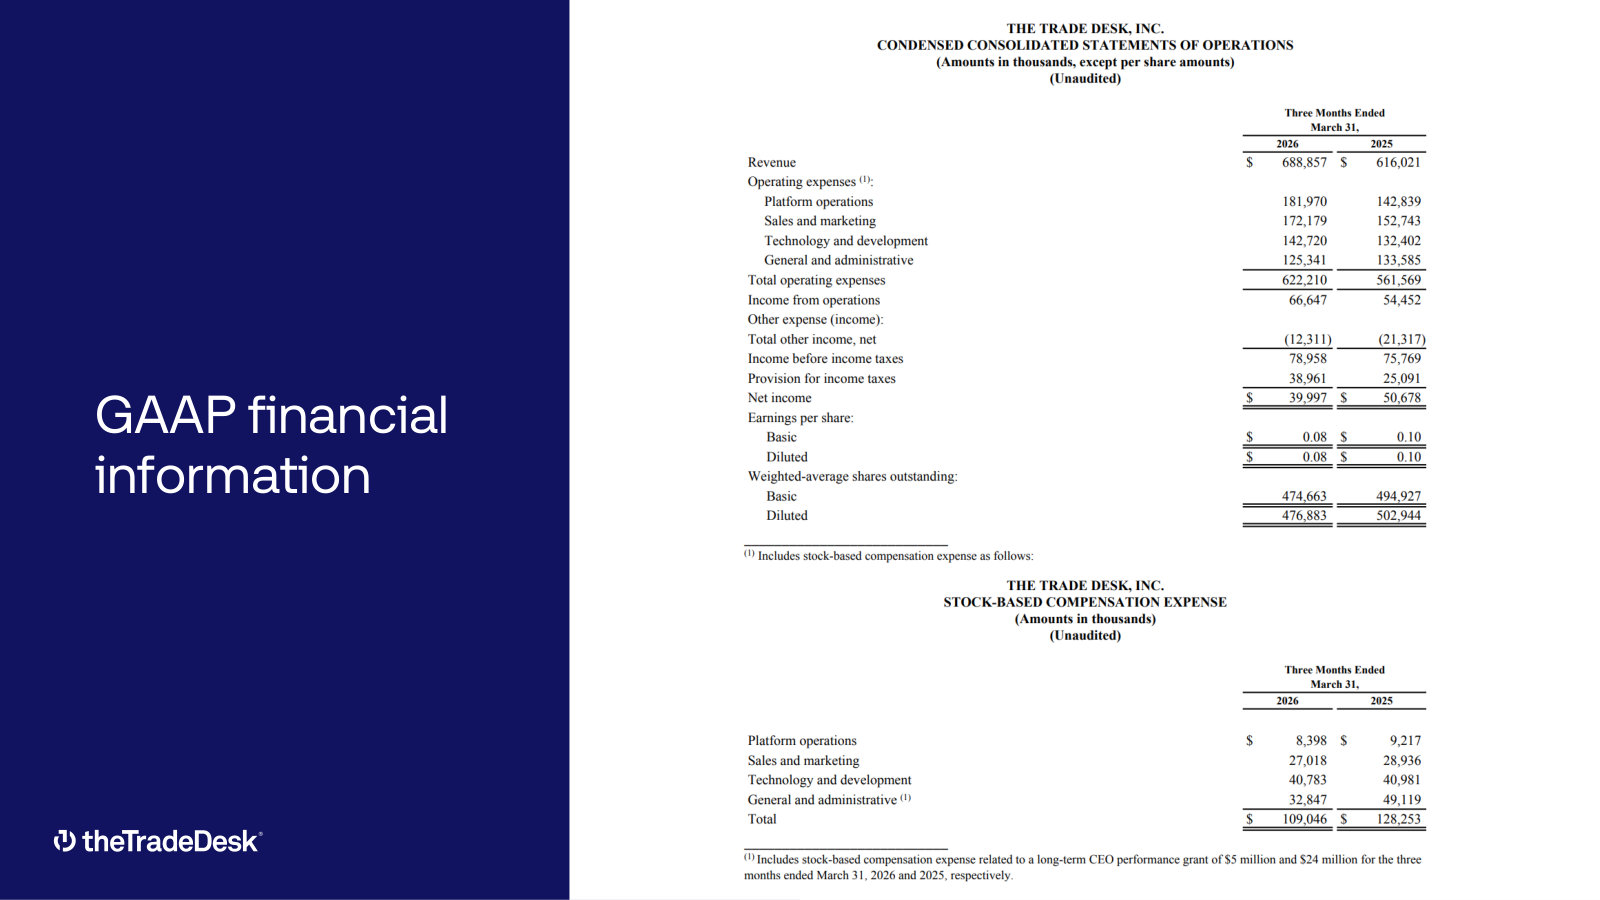
p. 3 — The business in one line — a platform for ad buyers, most of them agencies, brands or other technology companies. · Open the full presentation →p. 4 — The four claims the rest of the deck rests on: buy-side only, omnichannel, proprietary decisioning, measurement. · Open the full presentation →p. 5 — The service layer behind a self-serve platform — four client-facing teams, and part of why sales and marketing costs run high. · Open the full presentation →p. 6 — Eleven years of revenue and growth rates, plus 2025 net income, operating income and free cash flow on one page. · Open the full presentation →p. 10 — How management sizes its market: ~$280B open internet within a $1T+ total, set against search, social and traditional media. · Open the full presentation →p. 12 — Where the money goes between advertiser and publisher — $1.00 in, $0.55 out, and every intermediary in between. · Open the full presentation →p. 13 — The actual product: a live campaign view with budget, pacing and CPA targets. Worth seeing before reading any description of it. · Open the full presentation →p. 14 — The supply side — the publishers and streamers whose inventory TTD buys, from Netflix and Disney+ to Spotify and Walmart. · Open the full presentation →p. 16 — Why decisioning matters: the same inventory marked up for fraud, made-for-advertising sites, low viewability and excessive ad load. · Open the full presentation →p. 18 — The data marketplace's suppliers — third-party data sellers resold into bids, including Nielsen, Experian, LiveRamp and Kroger. · Open the full presentation →p. 19 — Spend by advertiser vertical, 2024 beside 2025 — nothing above 18%, which answers the concentration question in one table. · Open the full presentation →p. 20 — Offices by region: 3,800+ employees across 35+ markets, and where the international growth push is actually staffed. · Open the full presentation →p. 22 — The core technical argument as a funnel: first-party, third-party and proprietary data feeding one decisioning layer. · Open the full presentation →p. 24 — Bid factors versus line items — the architectural difference TTD claims separates it from every other demand-side platform. · Open the full presentation →p. 25 — The eight targeting inputs a buyer can use, from first-party uploads to linear-TV viewership and content signals. · Open the full presentation →p. 26 — Reporting depth as a selling point: 200+ performance measures across 300+ variables, shown inside the product. · Open the full presentation →p. 27 — What UID2 is and why TTD built it — an open-source, email-based identifier meant to outlast the third-party cookie. · Open the full presentation →p. 28 — UID2 end to end: how CRM data and the identity graph become an addressable ID, and what it interoperates with. · Open the full presentation →p. 29 — OpenPath in the supply chain — how TTD reaches publishers directly, and where SSPs and ad servers still sit. · Open the full presentation →p. 30 — OpenSincera: the supply-quality dataset TTD publishes free to the industry, and the strategic logic of giving it away. · Open the full presentation →p. 34 — The CTV supply roster in one wheel — streamers, sports rights and retail data sets reachable through a single platform. · Open the full presentation →p. 35 — The CTV pricing claim: $10 CPMs in traditional TV buying against $20 in data-driven connected TV. · Open the full presentation →p. 38 — The gap that underwrites the growth case: ~14% of revenue from outside North America versus ~60% of global ad dollars. · Open the full presentation →p. 40 — Retail data partnerships, plus the Walmart DSP arrangement — TTD technology carrying the largest US retailer's data. · Open the full presentation →p. 41 — Retail data marketplace coverage: over 80% of top-US-retailer sales, with Amazon's 14% sitting outside it. · Open the full presentation →p. 43 — The four things management says it runs the business on: culture, customer retention, top-line growth, efficiency. · Open the full presentation →p. 44 — The Q1 2026 P&L with expense lines and stock-based compensation broken out — $109M of SBC on $689M of revenue. · Open the full presentation →
The last edition before the 2026 redesign; it still carries gross spend, bid-factor mechanics and the quarterly financial series. · Open the full document →
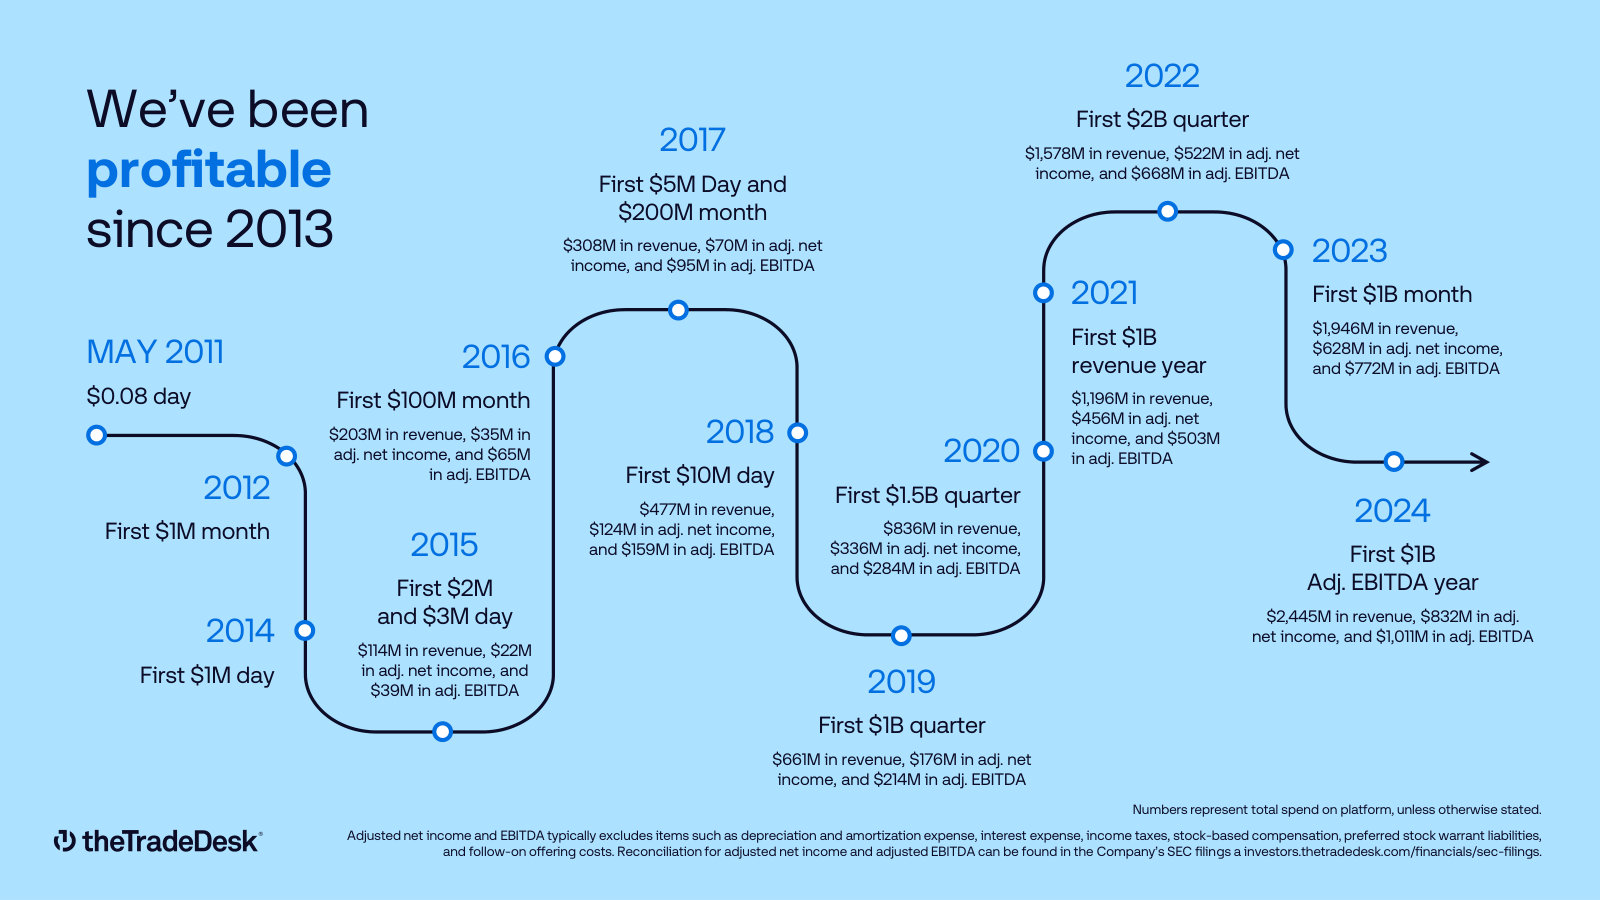
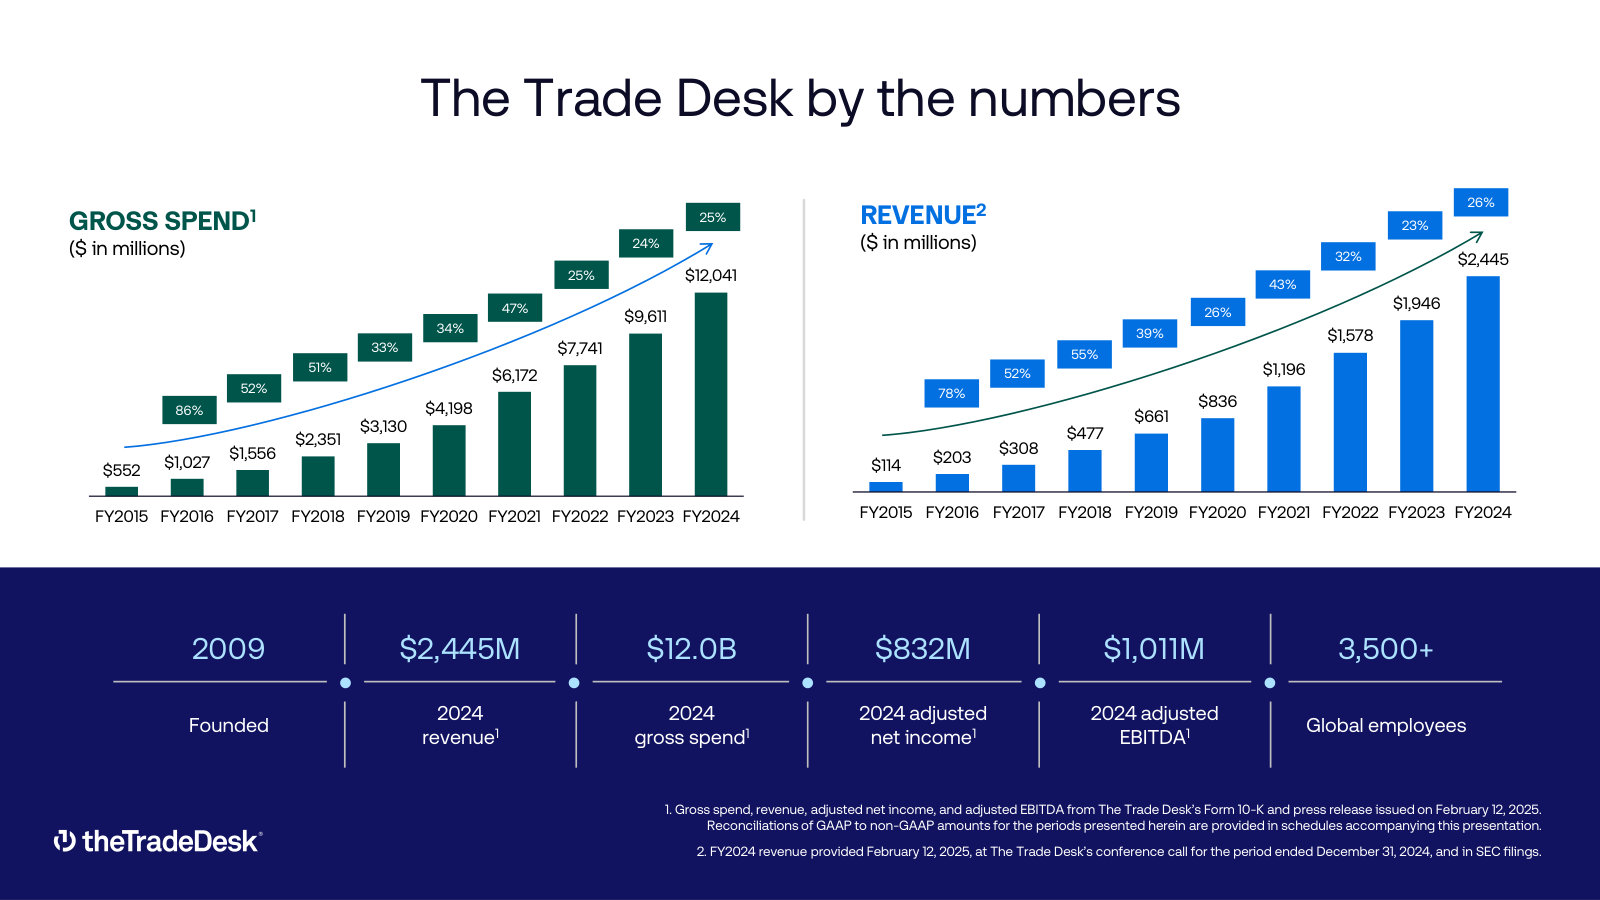
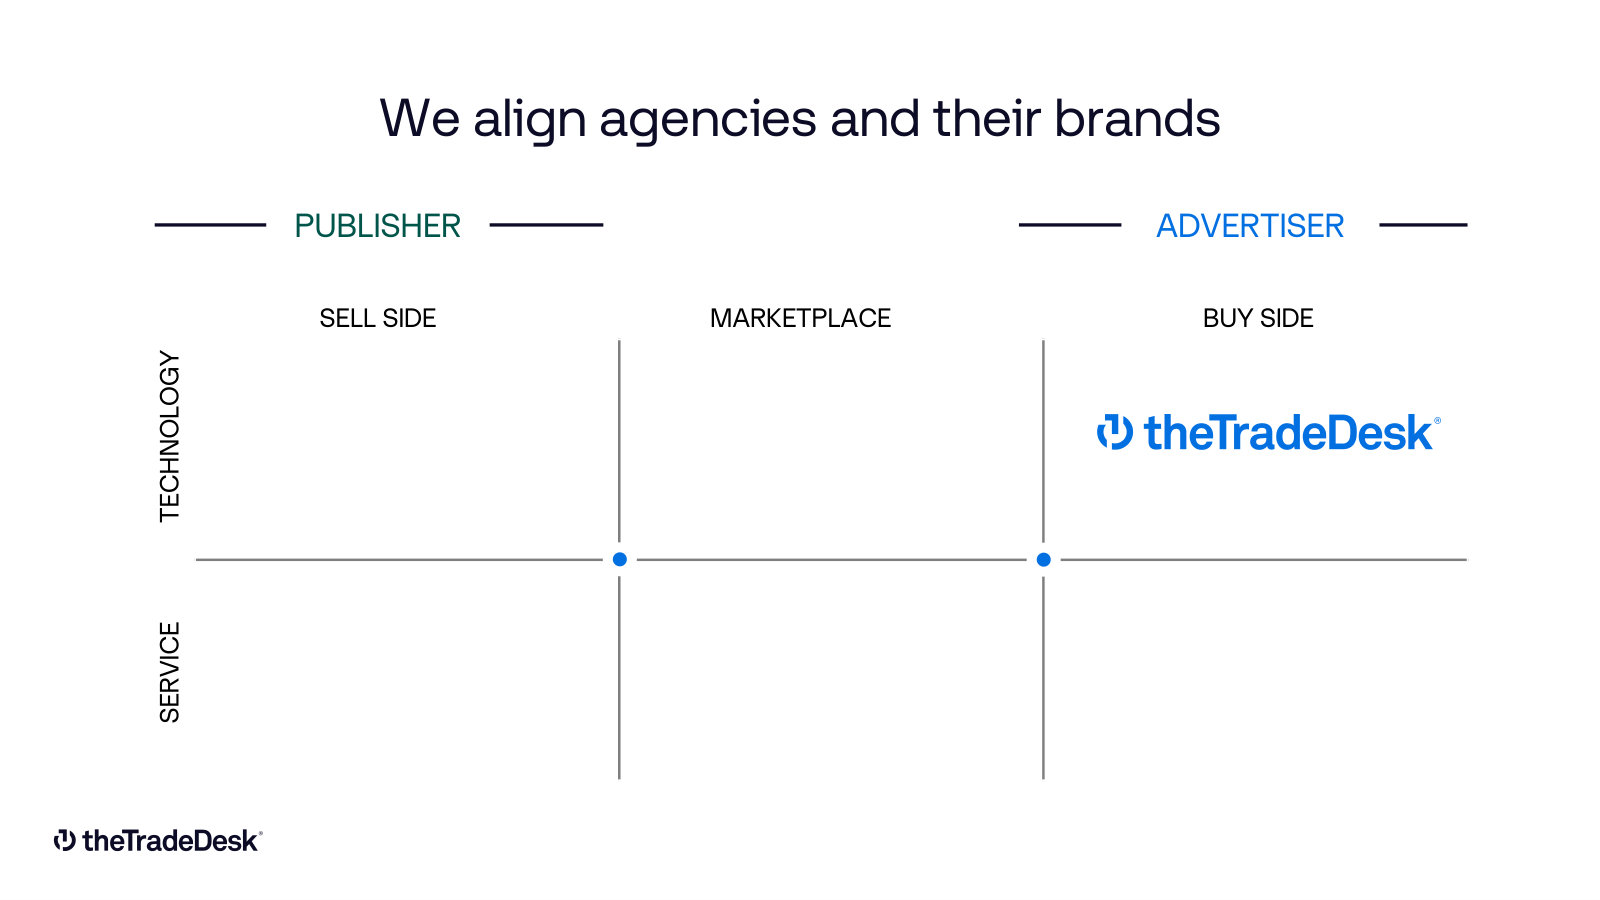
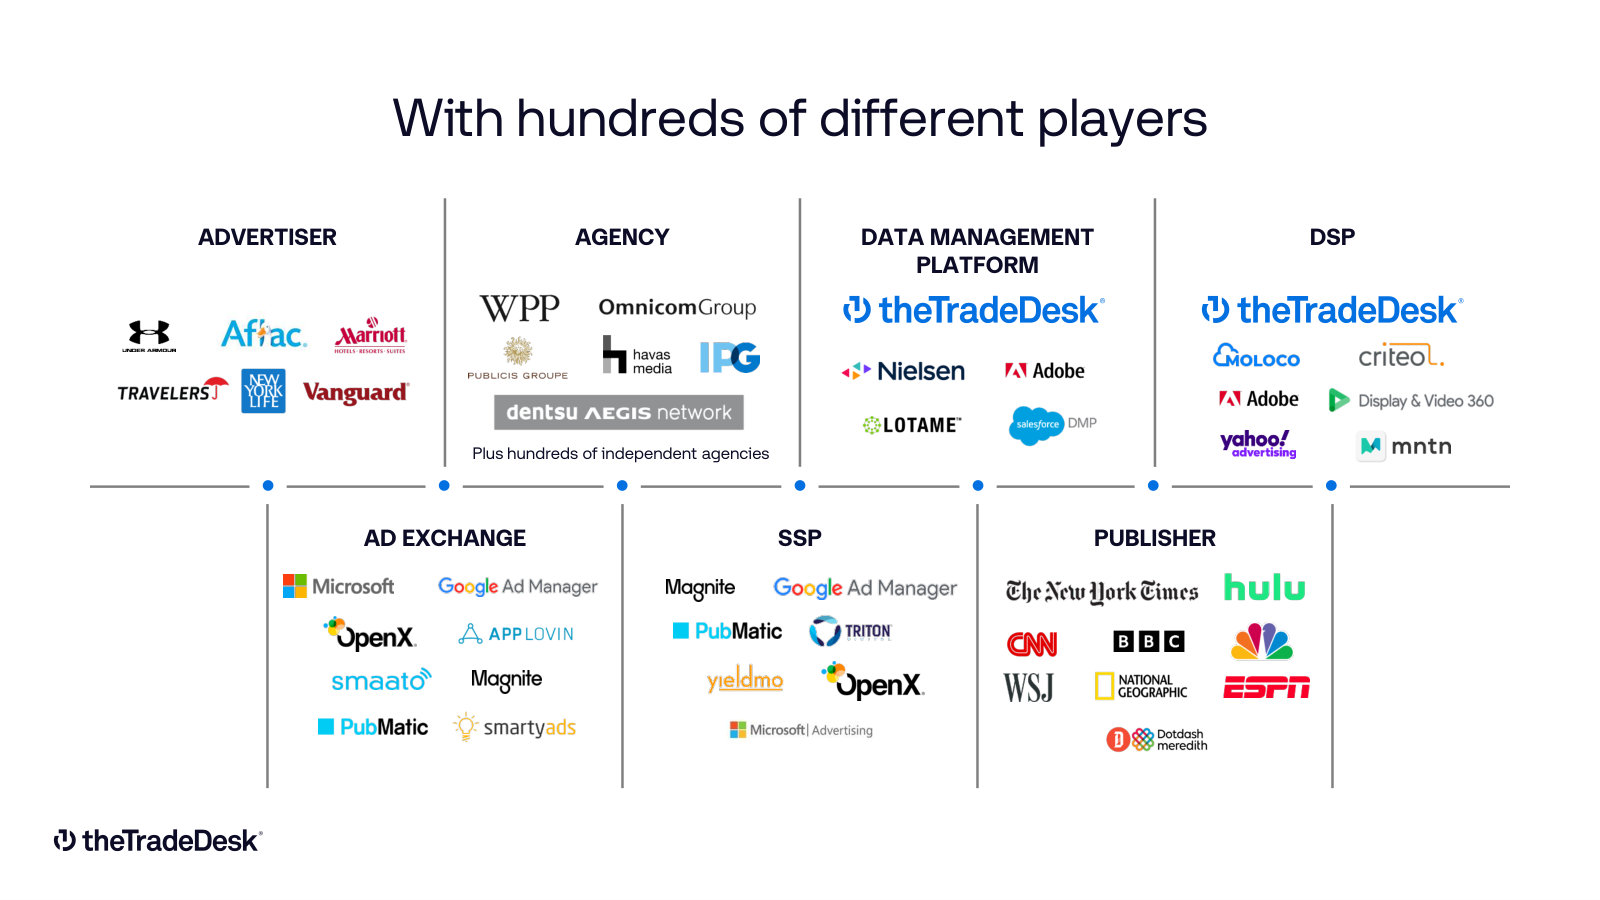
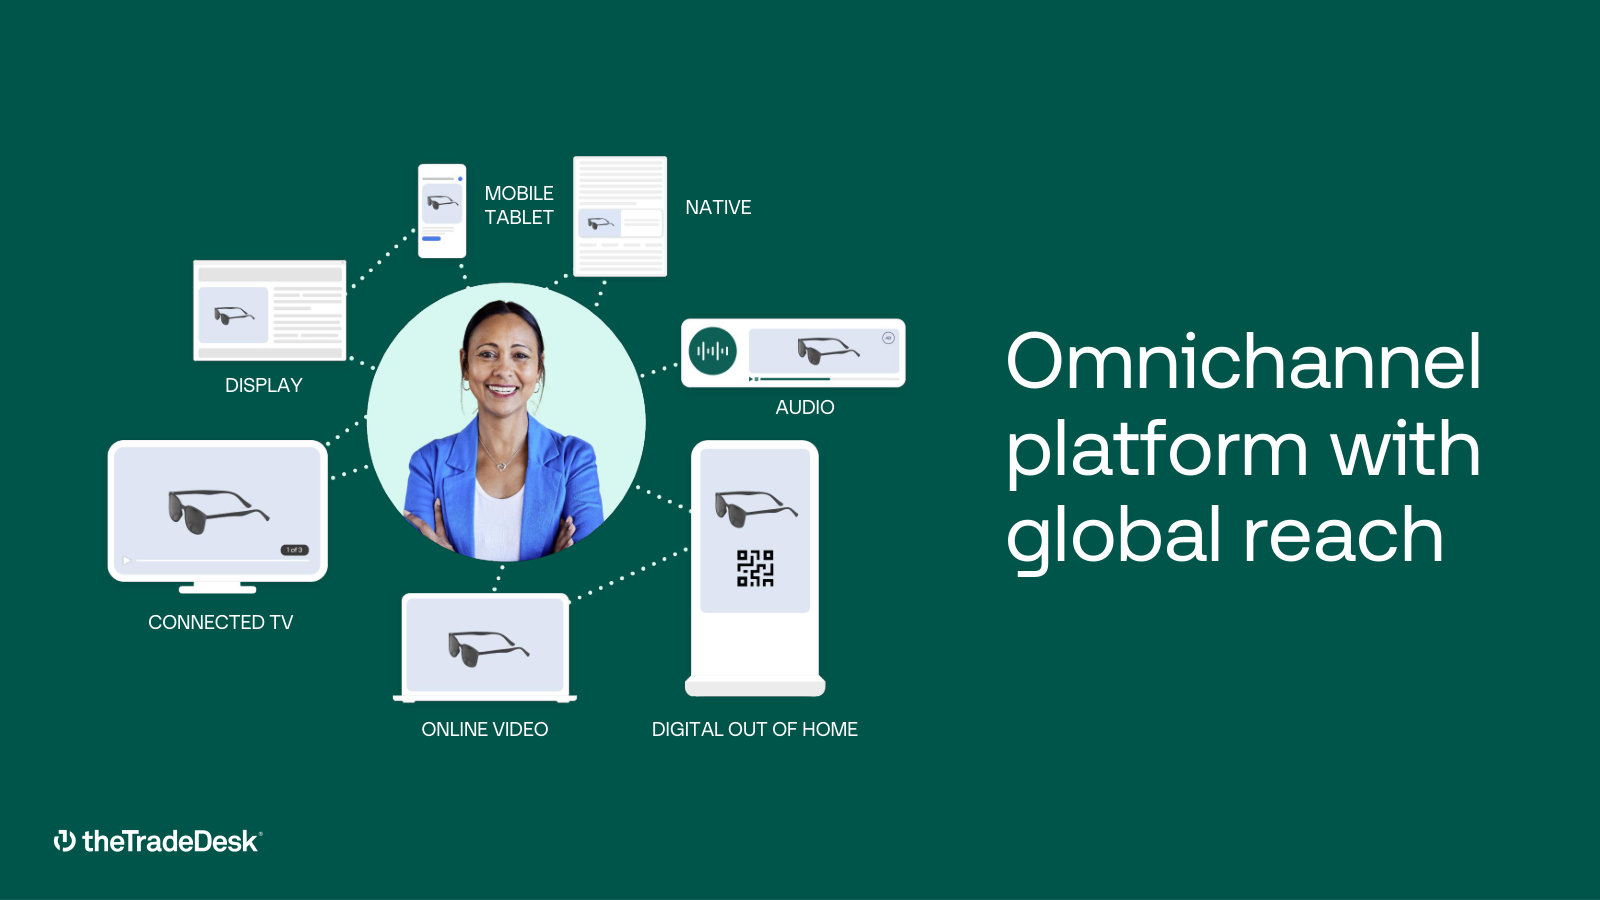
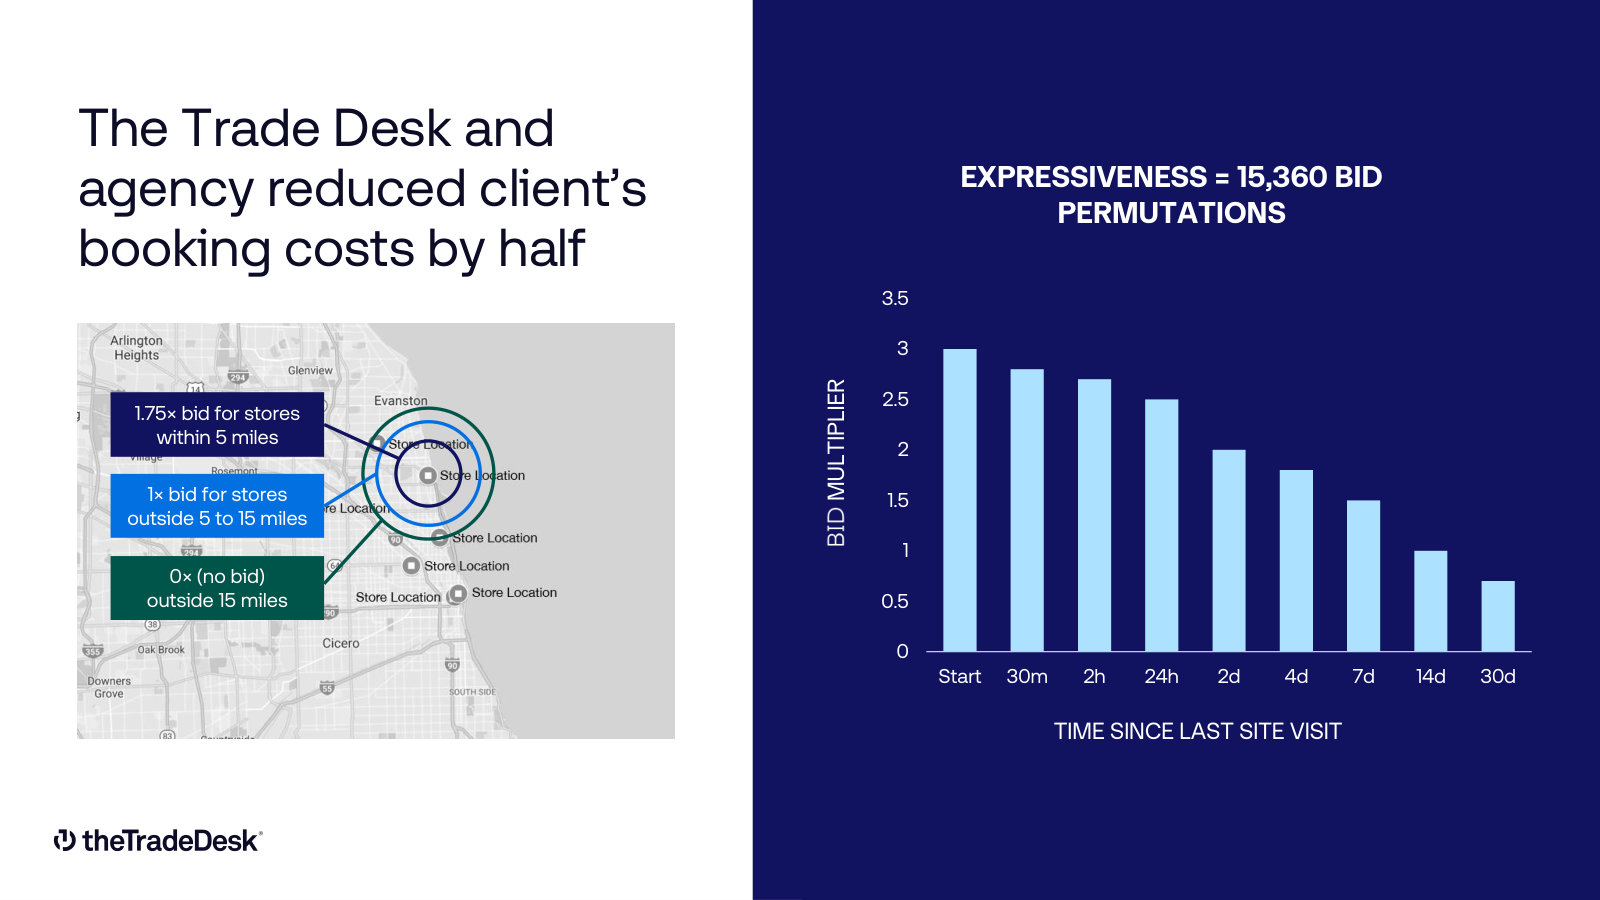
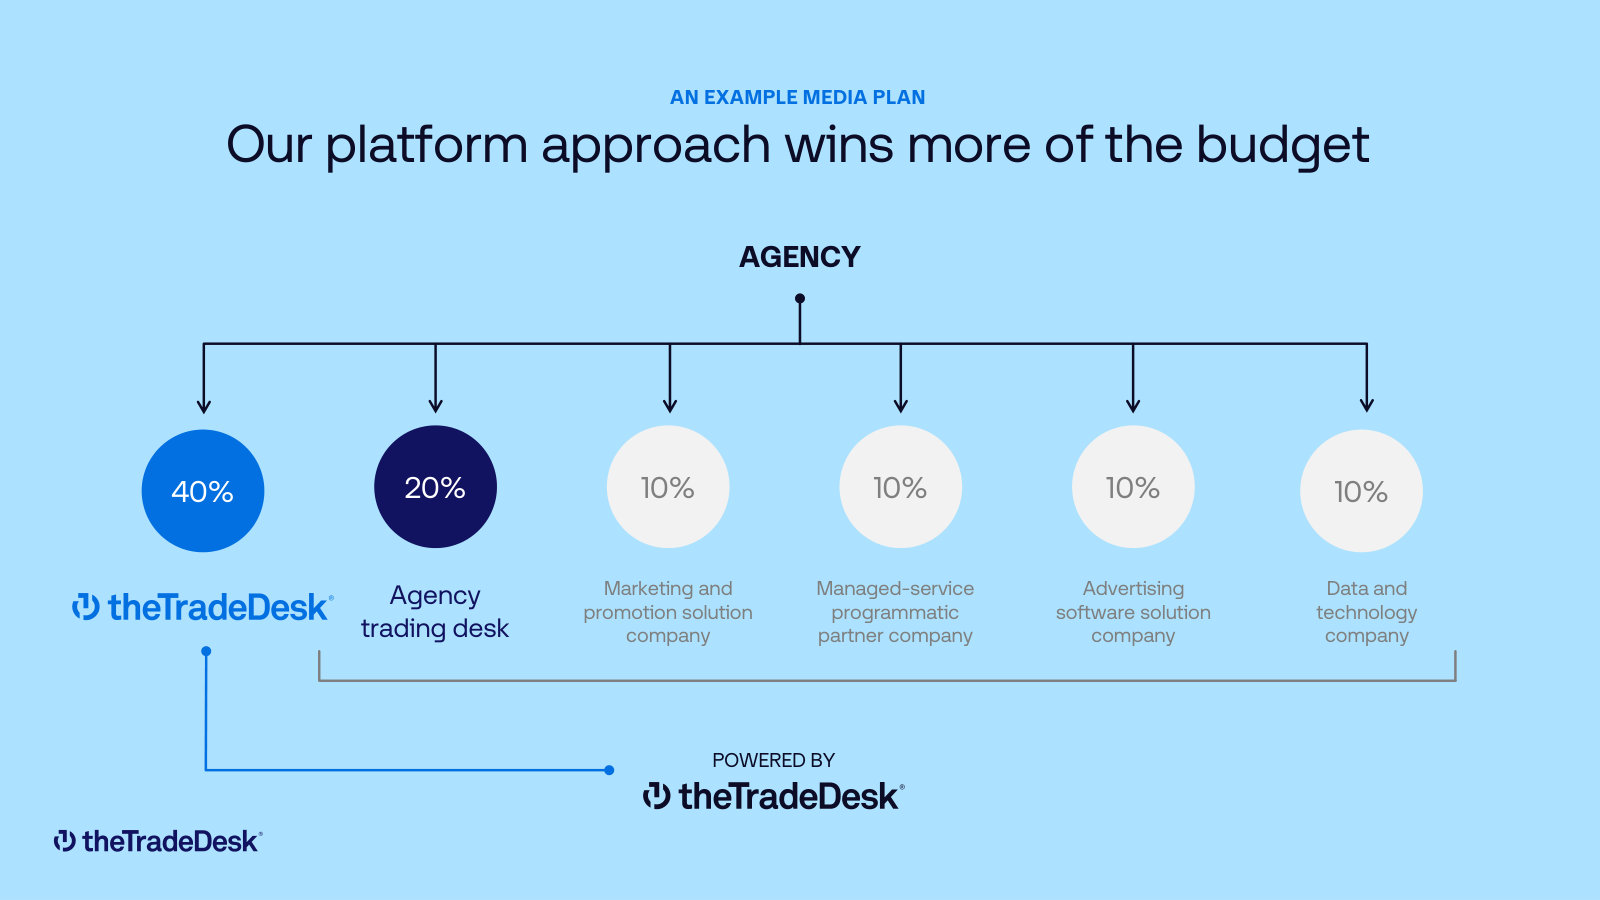
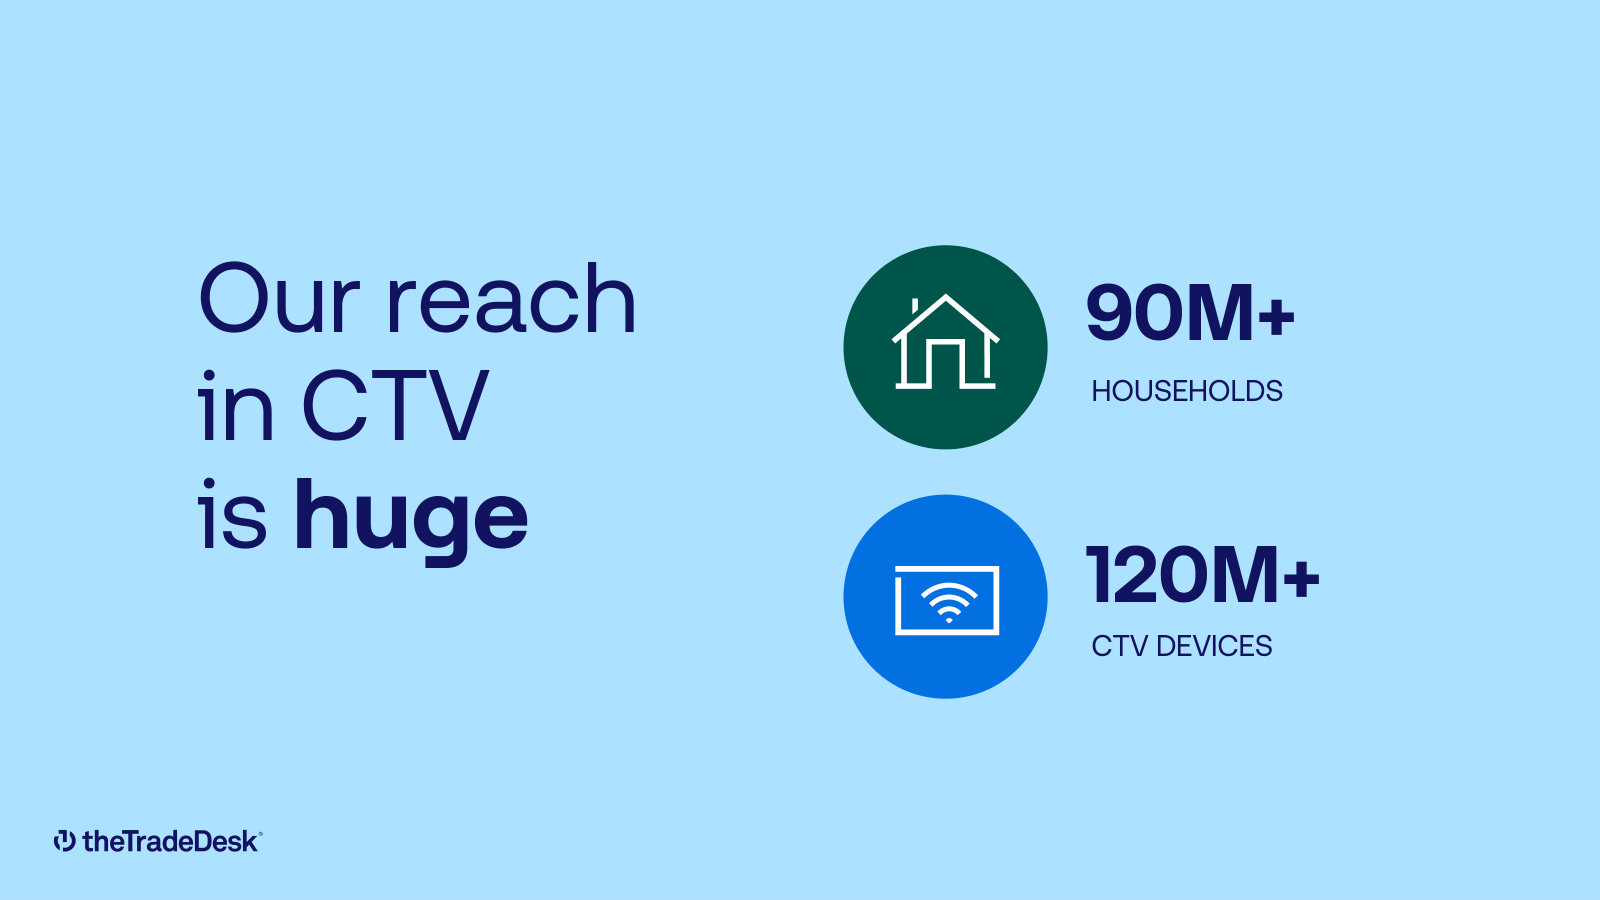
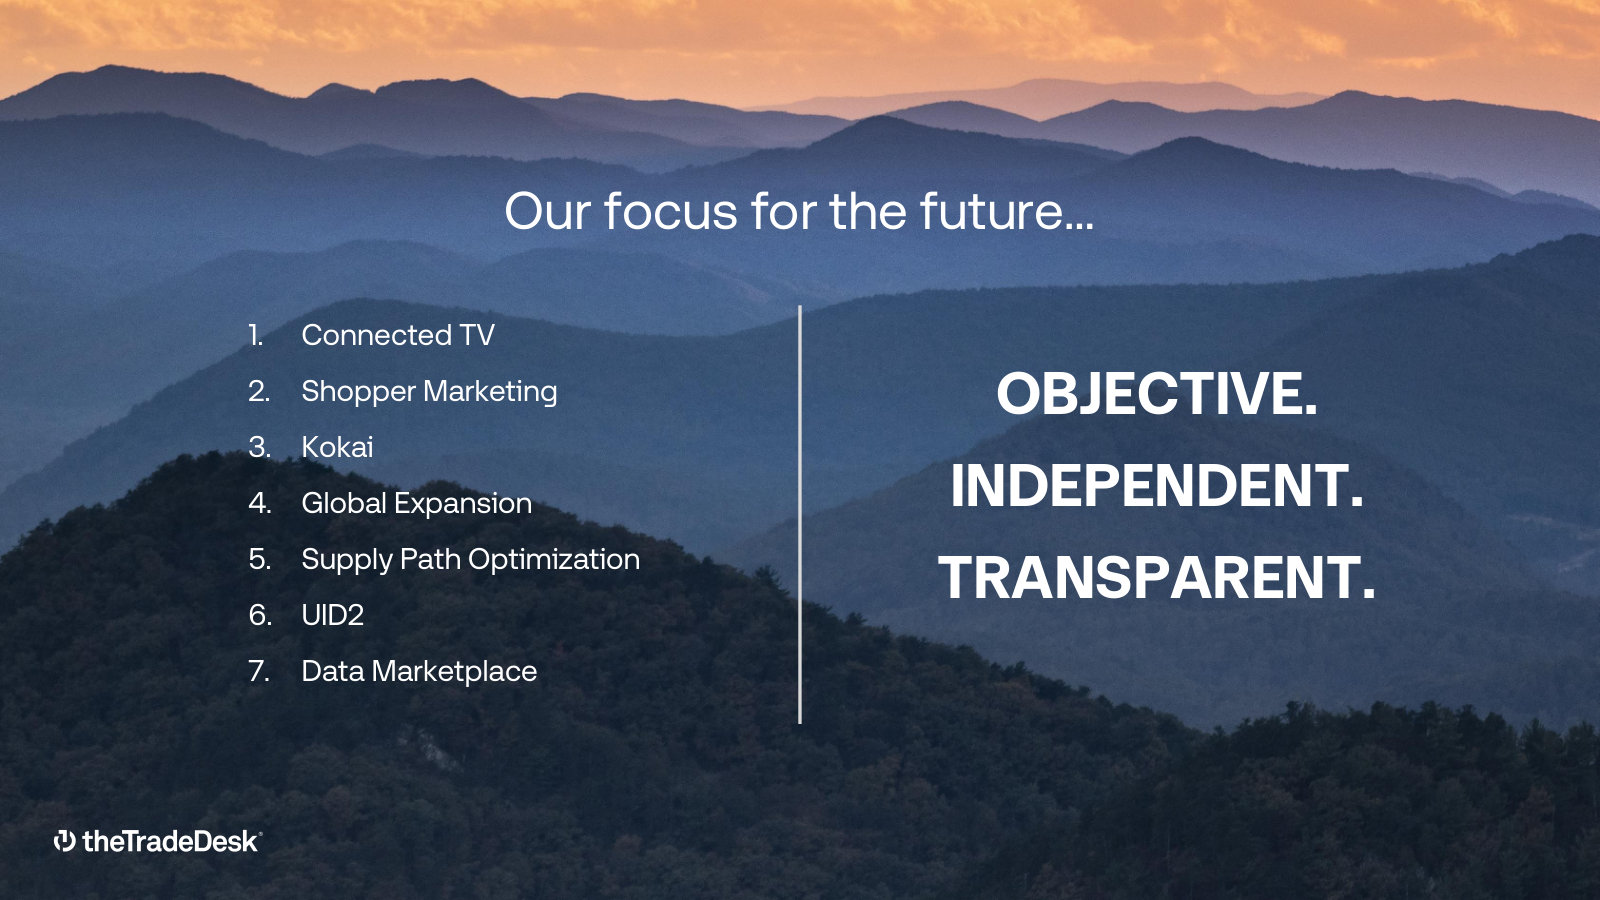
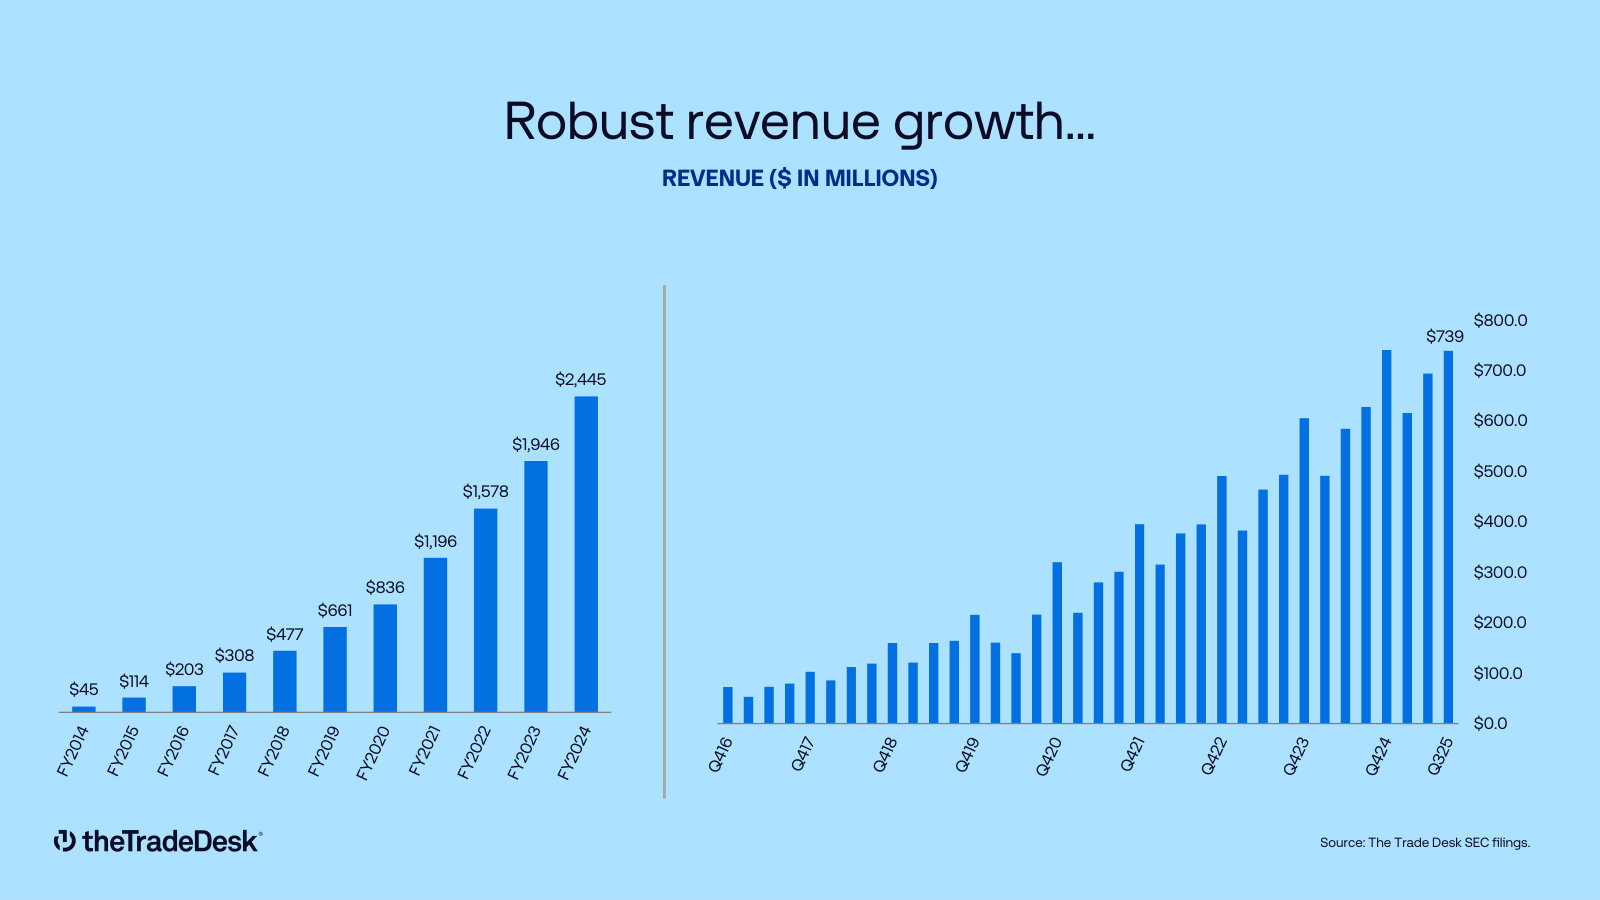
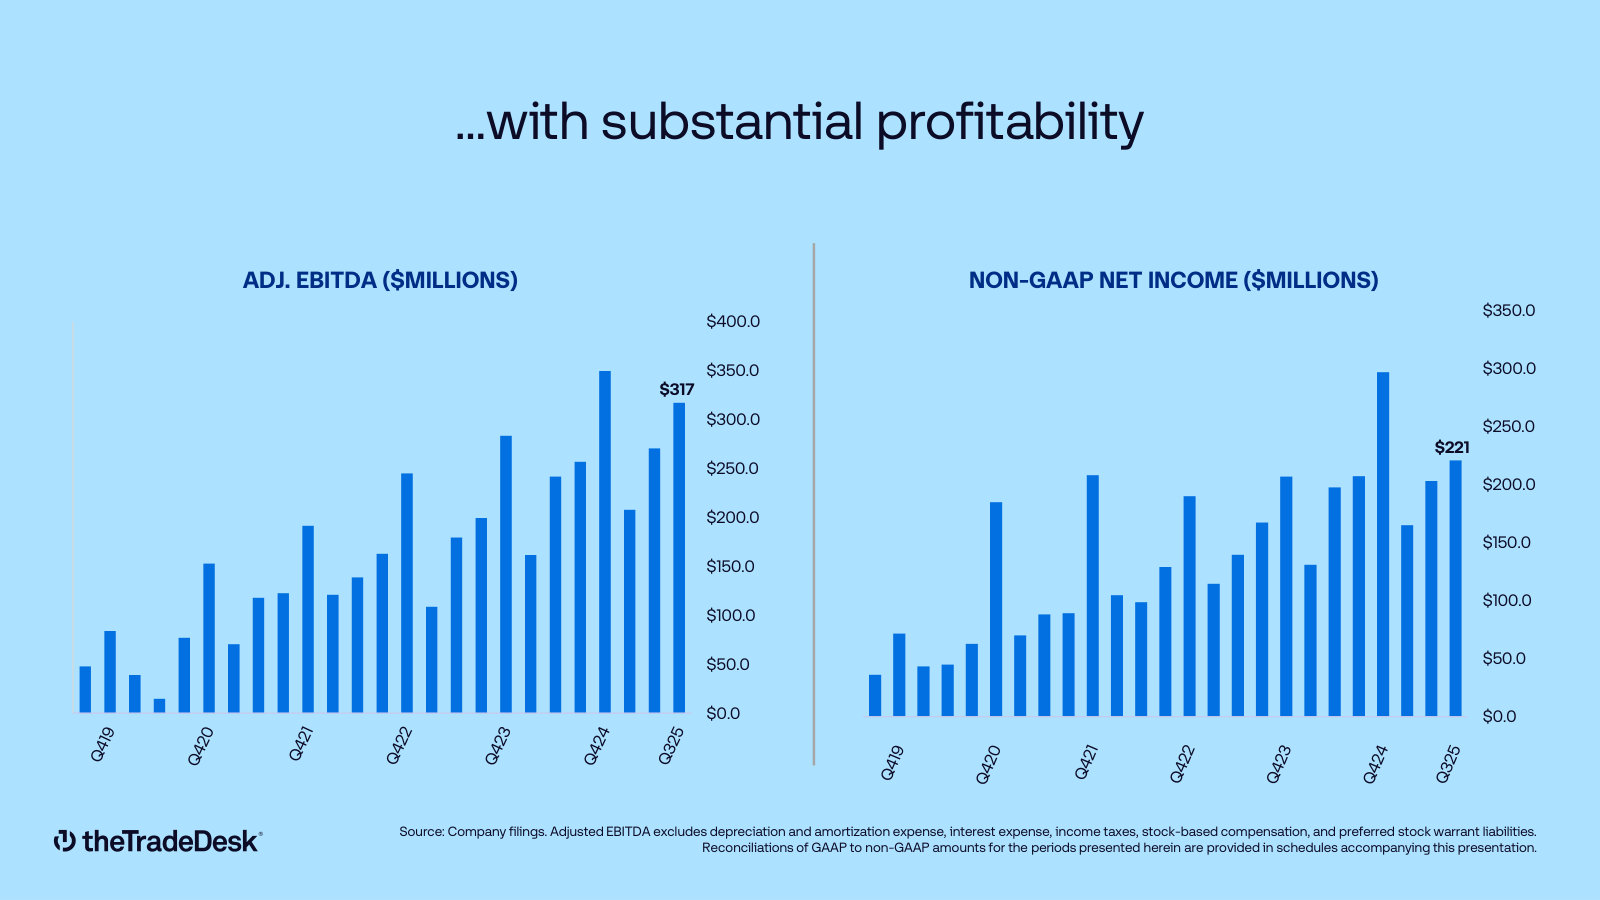
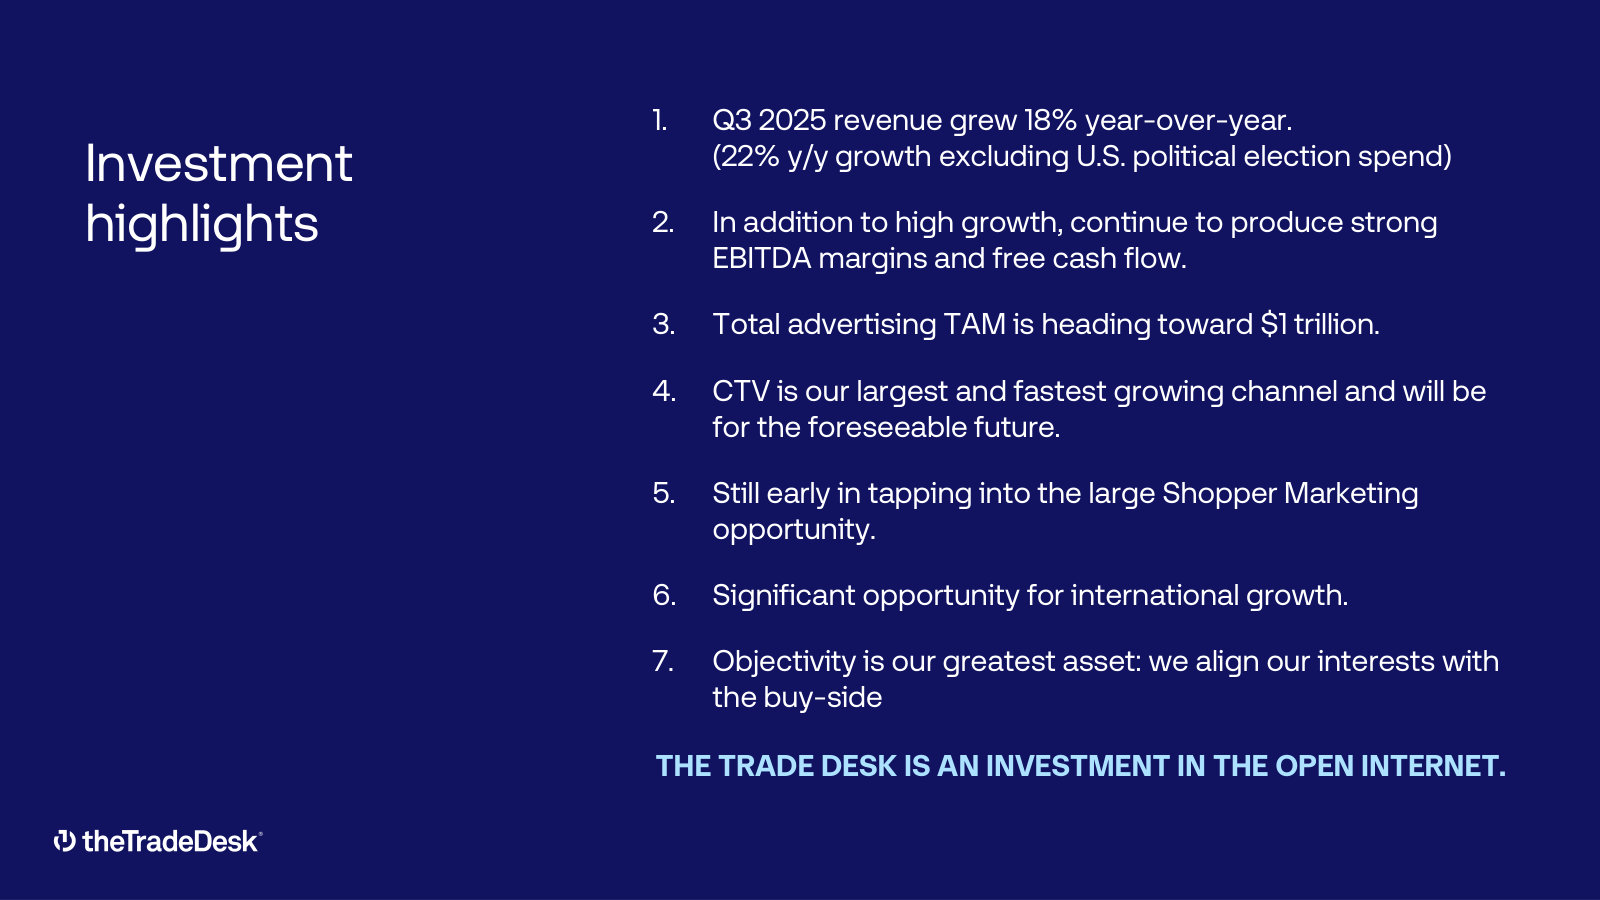
p. 4 — Milestone history from a $0.08 day in 2011 through 2024, with revenue, adjusted net income and adjusted EBITDA at each step. · Open the full presentation →p. 5 — Gross spend beside revenue — $12.0B of platform spend against $2,445M of revenue in FY2024. The take rate in one chart. · Open the full presentation →p. 13 — The positioning map: TTD occupies one cell only — buy-side technology, with no sell-side business and no media service arm. · Open the full presentation →p. 14 — The ad-tech ecosystem with names in every box, competing DSPs included. The clearest market-structure page in the corpus. · Open the full presentation →p. 15 — The channels one campaign can span — display, connected TV, audio, native, online video and digital out-of-home. · Open the full presentation →p. 27 — How bid factors work in practice: geographic multipliers around store locations and a decay curve since last site visit. · Open the full presentation →p. 28 — An agency media plan split six ways, with TTD taking 40% directly and another 20% through the agency's trading desk. · Open the full presentation →p. 35 — The connected TV footprint management claimed in 2025: 90M+ households and 120M+ devices. · Open the full presentation →p. 44 — The seven strategic priorities as management ranked them — CTV, shopper marketing, Kokai, international, supply path, UID2, data. · Open the full presentation →p. 46 — The revenue model in words: master service agreements and joint business plans, and why self-serve software gives operating leverage. · Open the full presentation →p. 47 — Revenue by fiscal year beside revenue by quarter — the quarterly view shows the Q4 seasonality the annual bars hide. · Open the full presentation →p. 48 — Adjusted EBITDA and non-GAAP net income by quarter since 2019 — margin history, and the same fourth-quarter spike. · Open the full presentation →p. 49 — Management's own seven-point investment case, ending on 'an investment in the open internet'. · Open the full presentation →
Investor Relations Presentation — FY2025 · 48 pages · FY2025 full-year edition and first outing of the redesigned deck; keeps the seven-point 'focus for the future' list the May version dropped. · Open →
Investor Presentation — FY2023 · 51 pages · The FY2023 pitch, including the TAM build-up slide later editions cut — useful for seeing which arguments management has retired. · Open →
Investor Presentation — Q2 2023 · 52 pages · Earliest deck in the corpus; the pre-Kokai, pre-shopper-marketing baseline against which the current story can be compared. · Open →