Annual Reports
The Trade Desk, Inc.'s annual reports contain management's most considered account of the business. These are the sections, passages and visual pages worth opening in the originals preserved in Sources.
The Trade Desk, Inc. — FY2025 Annual Report (Form 10-K) — FY2025 (year ended December 31, 2025)
The latest 10-K: revenue +18% on gross spend +11%, one segment, and a client base where two holding companies each cleared 10% of billings. · Open the full document →
Item 1. Business — Overview and Our Industry — p. 7 · Read the full section →
Management's own definition of the business and the fee model: a percentage of client platform spend, plus value-added services and data.
What TTD sells, to whom, and exactly what it charges for.
We are a global leader in advertising technology. We empower ad buyers to create, manage and optimize digital advertising campaigns across ad formats, channels and devices. Our platform’s depth, artificial intelligence (“AI”) capabilities and rich ecosystem of inventory, publisher and data partner integrations enable superior reach and decisioning for clients. […] Our clients are advertising agencies, advertisers and other service providers for agencies or advertisers, with whom we enter into ongoing master services agreements (“MSAs”). We generate revenue by charging our clients a platform fee generally based on a percentage of our clients’ total platform spend and from providing value-added services and data to support their advertising campaigns.
p. 7 · Read in context →
The four demand trends management is underwriting: CTV, a $1 trillion ad TAM, AI and privacy-era data.
Digital advertising is reported to represent the largest and fastest-growing segment of the global advertising industry, with estimated annual spend of over $700 billion and representing more than 70% of the total market spend. […] Rapid Growth of CTV. We are witnessing a generational shift from linear television to connected television (“CTV”) as Internet and television programming converge. […] Expansion of Global Advertising TAM and Programmatic Advertising. The total addressable market (“TAM”) for global advertising is reported to have surpassed $1 trillion for the first time in 2024. […] AI Driven Personalization and Automation. AI is fundamentally changing the media landscape, from the creative process all the way to the execution of advertising campaigns.
p. 7 · Read in context →
Item 1. Business — Our Clients and Our Advertising Inventory and Data Suppliers — p. 16 · Read the full section →
Both sides of the platform in numbers: 60-day-cancellable MSAs and two >10% holding companies against 430 supply integrations.
Contract terms, holding-company concentration, and the size of the supply and data ecosystem.
Our MSAs, some of which may include joint business plans and other incentive programs, do not contain any material commitments on behalf of clients to use our platform to purchase ad inventory, value-added services or data. Generally, these MSAs have one-year terms that renew automatically for additional one-year periods, unless earlier terminated, and are terminable at any time upon 60 days’ notice by either party. […] If all of our individual client contractual relationships were aggregated at the holding company level, two holding companies would have each represented more than 10% of our gross billings in 2025 and one holding company would have represented more than 10% of our gross billings in 2024. […] We obtain digital advertising inventory from over 430 directly integrated ad exchanges, publishers and supply-side platforms, providing us with access to a breadth of programmatic advertising inventory across televisions, streaming devices, mobile devices, computers and digital-out-of-home devices. […] As of December 31, 2025, we have integrated our platform with more than 370 third-party data vendors whose products are available for purchase through our platform.
p. 16 · Read in context →
Item 1A. Risk Factors — Client Concentration and Access to Inventory — p. 24 · Read the full section →
The two supply-and-demand dependencies with named counterparties: agency holding companies on one side, Google on the other.
"The loss of advertising agencies, advertisers or holding companies as clients" — two exceeded 10% of 2025 gross billings.
Our clients include advertising agencies, many of which are owned by holding companies, where decision making is decentralized such that purchasing decisions are made, and relationships with advertisers are located, at the agency, local branch or division level. If all of our individual client contractual relationships were aggregated at the holding company level, two holding companies would have each represented more than 10% of our gross billings for 2025. […] A holding company may be acquired by, or consolidate with, another holding company that does not utilize our platform, or a holding company may choose to exert control over its individual agencies in a way that may otherwise result in an overall reduction in our revenue. If so, any consolidation of, or loss of relationships with such holding companies and consequently, of their agencies, local branches or divisions, as clients could significantly harm our business, financial condition and results of operations.
p. 24 · Read in context →
Item 1A. Risk Factors — Identifier Dependence and Agency Payment Terms — p. 38 · Read the full section →
Two structural exposures: TTD does not control the identifiers its targeting relies on, and agencies owe it only what advertisers pay them.
"Third parties control our access to unique identifiers" — the dependency behind the whole targeting stack.
Third parties control our access to unique identifiers, and if the use of “third-party cookies” or other technology to uniquely identify devices or users is rejected by Internet users, restricted or otherwise subject to unfavorable regulation, blocked or limited by preference signals, technical changes on end users’ devices and web browsers, or our clients’ ability to use data, including on our platform or related offerings is otherwise restricted, our performance may decline, and we may lose advertisers and revenue. […] For example, if publishers or supply-side platforms decide to limit the data that we receive in order to comply (in their view) with state privacy laws, a potential federal privacy law or in response to other legal or industry developments, then our service may prove to be less valuable to our clients and we may find it more difficult to generate revenue. […] Digital advertising mostly relies on the ability to uniquely identify devices or users across websites and applications, and to collect data about user interactions for purposes such as serving relevant ads and measuring the effectiveness of ads.
p. 38 · Read in context →
Item 7. MD&A — Executive Summary — p. 77 · Read the full section →
The five numbers management leads with, and the opportunity list it says the spending is aimed at.
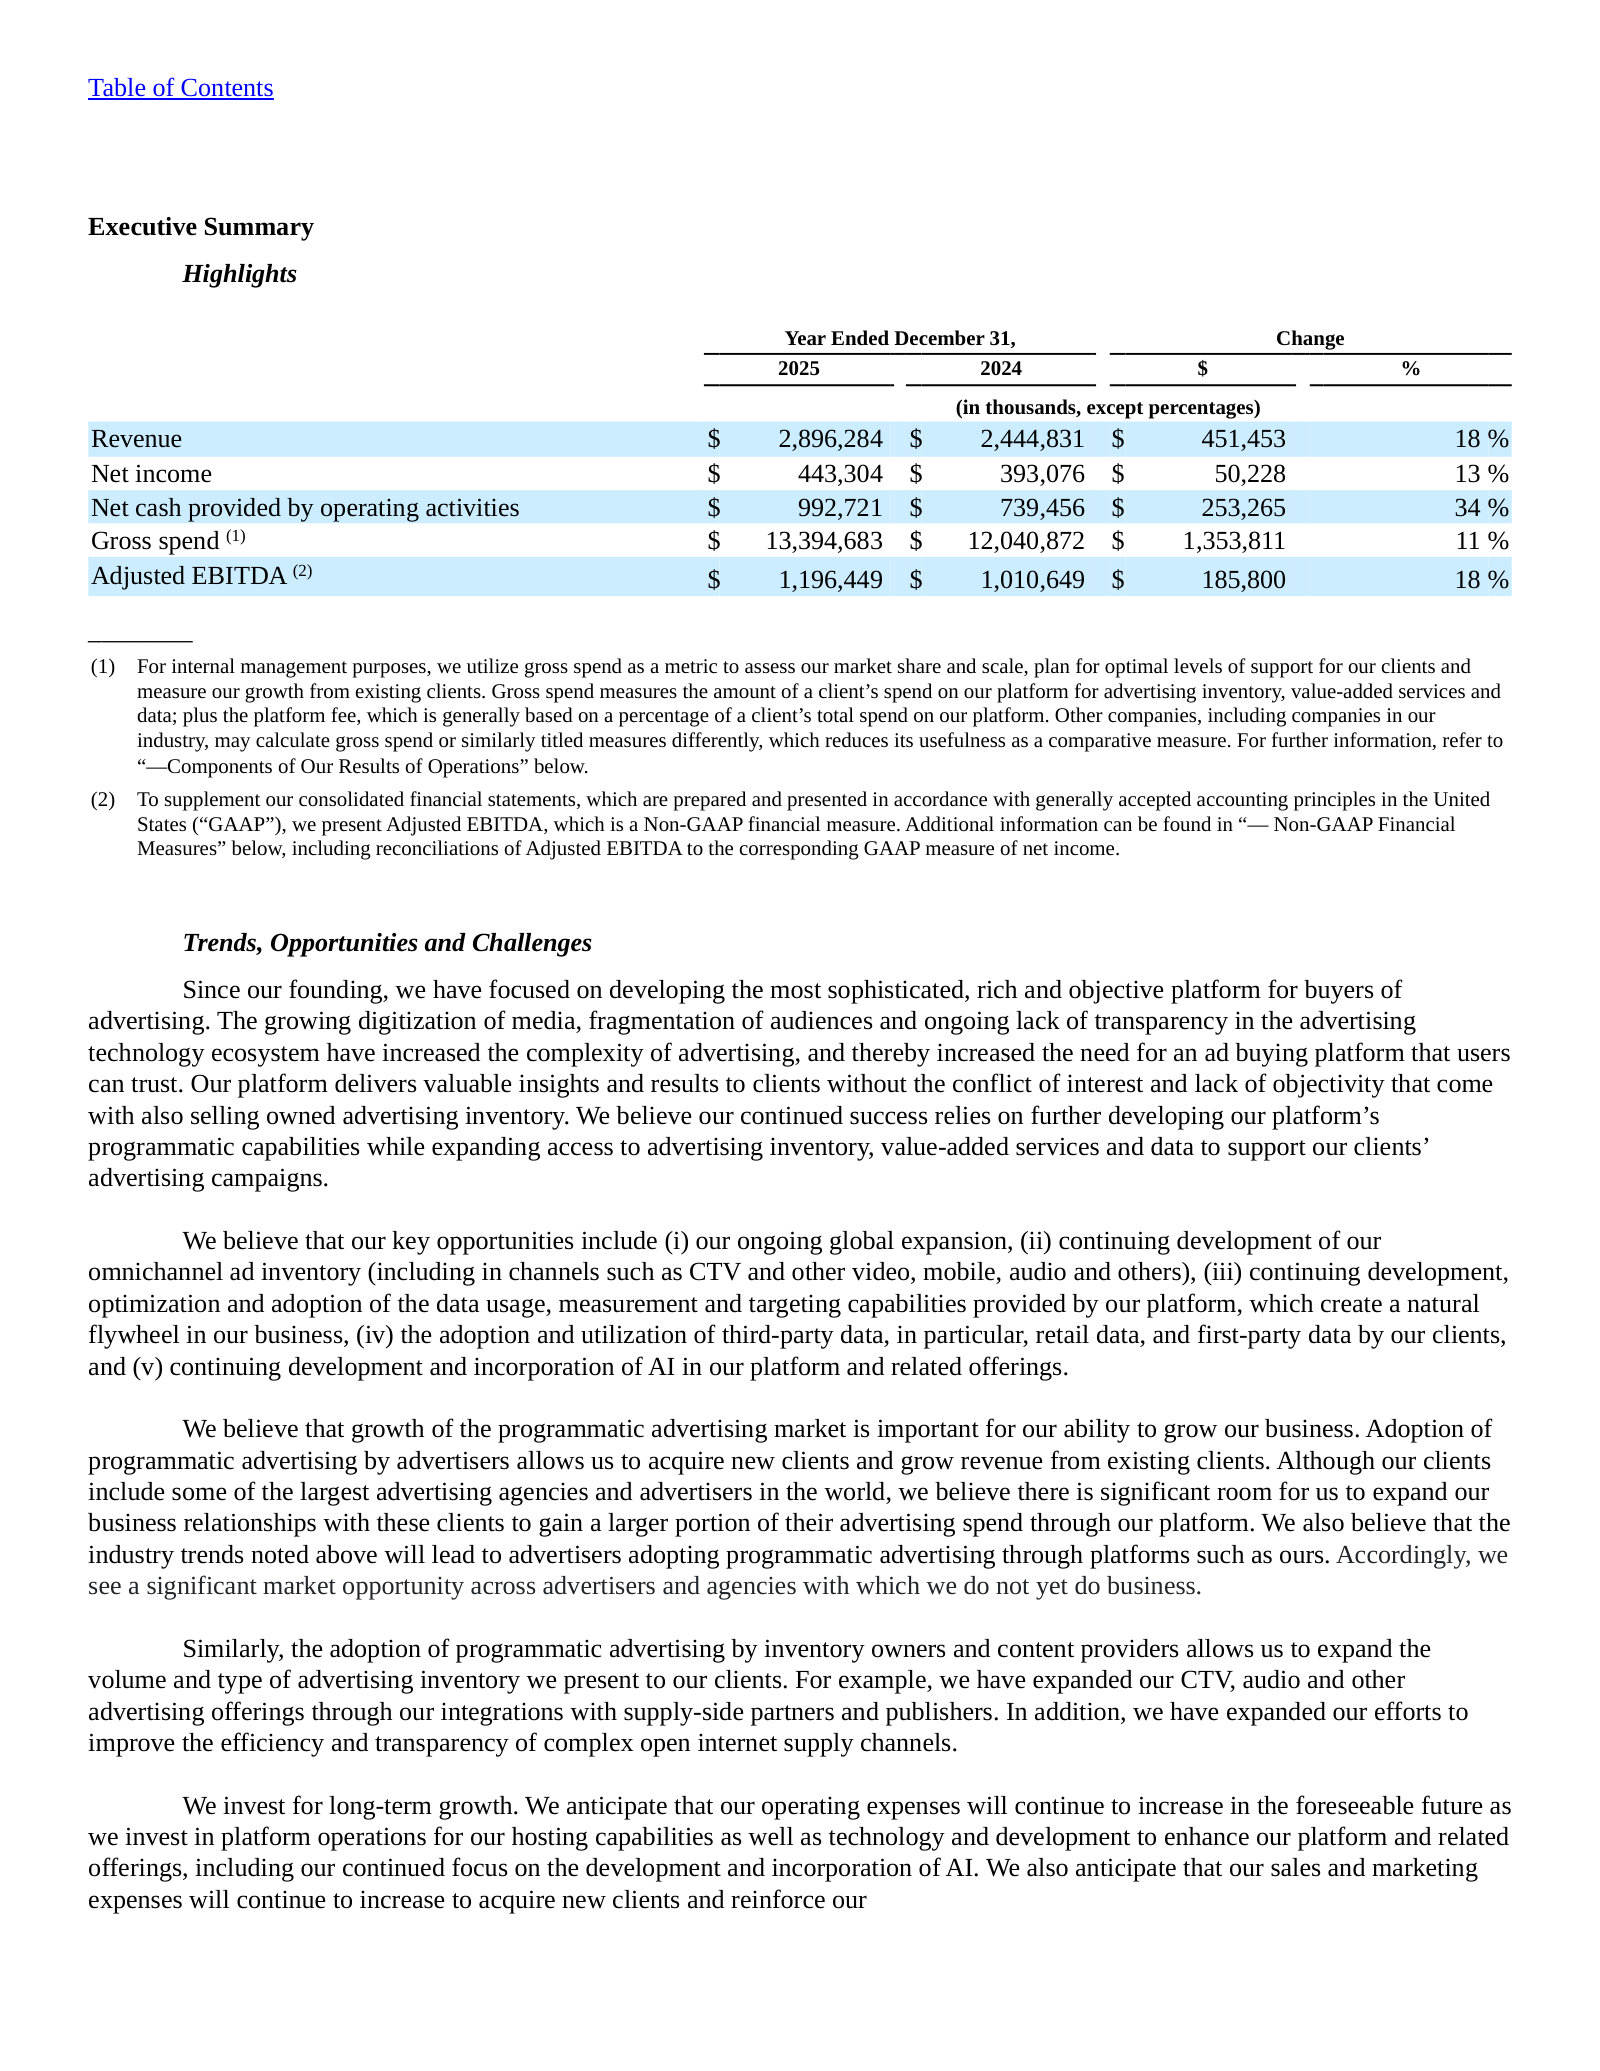
Item 7. MD&A — Components of Our Results of Operations — Revenue — p. 81 · Read the full section →
The accounting that defines the model: revenue booked as agent, net of supplier costs, which is why receivables and payables dwarf revenue.
One segment, net (agent) revenue recognition, and the reason the balance sheet looks outsized.
We have one primary business activity and one operating segment. […] We charge our clients for total spend on our platform, which includes spend and fees on advertising inventory, value-added services and data to support those purchases, in addition to the platform fee that is generally based on a percentage of our clients’ total spend on the platform. Generally, we report revenue as an agent on a net basis, which represents gross billings net of amounts we pay suppliers for the cost of advertising inventory, supplier-provided components of value-added services and data (collectively, “Supplier Components”). […] Accounts receivable is recorded at the amount of gross billings to clients, net of allowances, for the amounts we are responsible to collect; and our accounts payable are recorded at the amount payable to suppliers. Accordingly, both accounts receivable and accounts payable appear large in relation to revenue reported on a net basis.
p. 81 · Read in context →
Item 7. MD&A — Results of Operations for the Year Ended December 31, 2025, Compared with the Year Ended December 31, 2024 — p. 85 · Read the full section →
Revenue grew 18% on 11% gross-spend growth: management attributes the gap to pricing and higher use of value-added services and data.
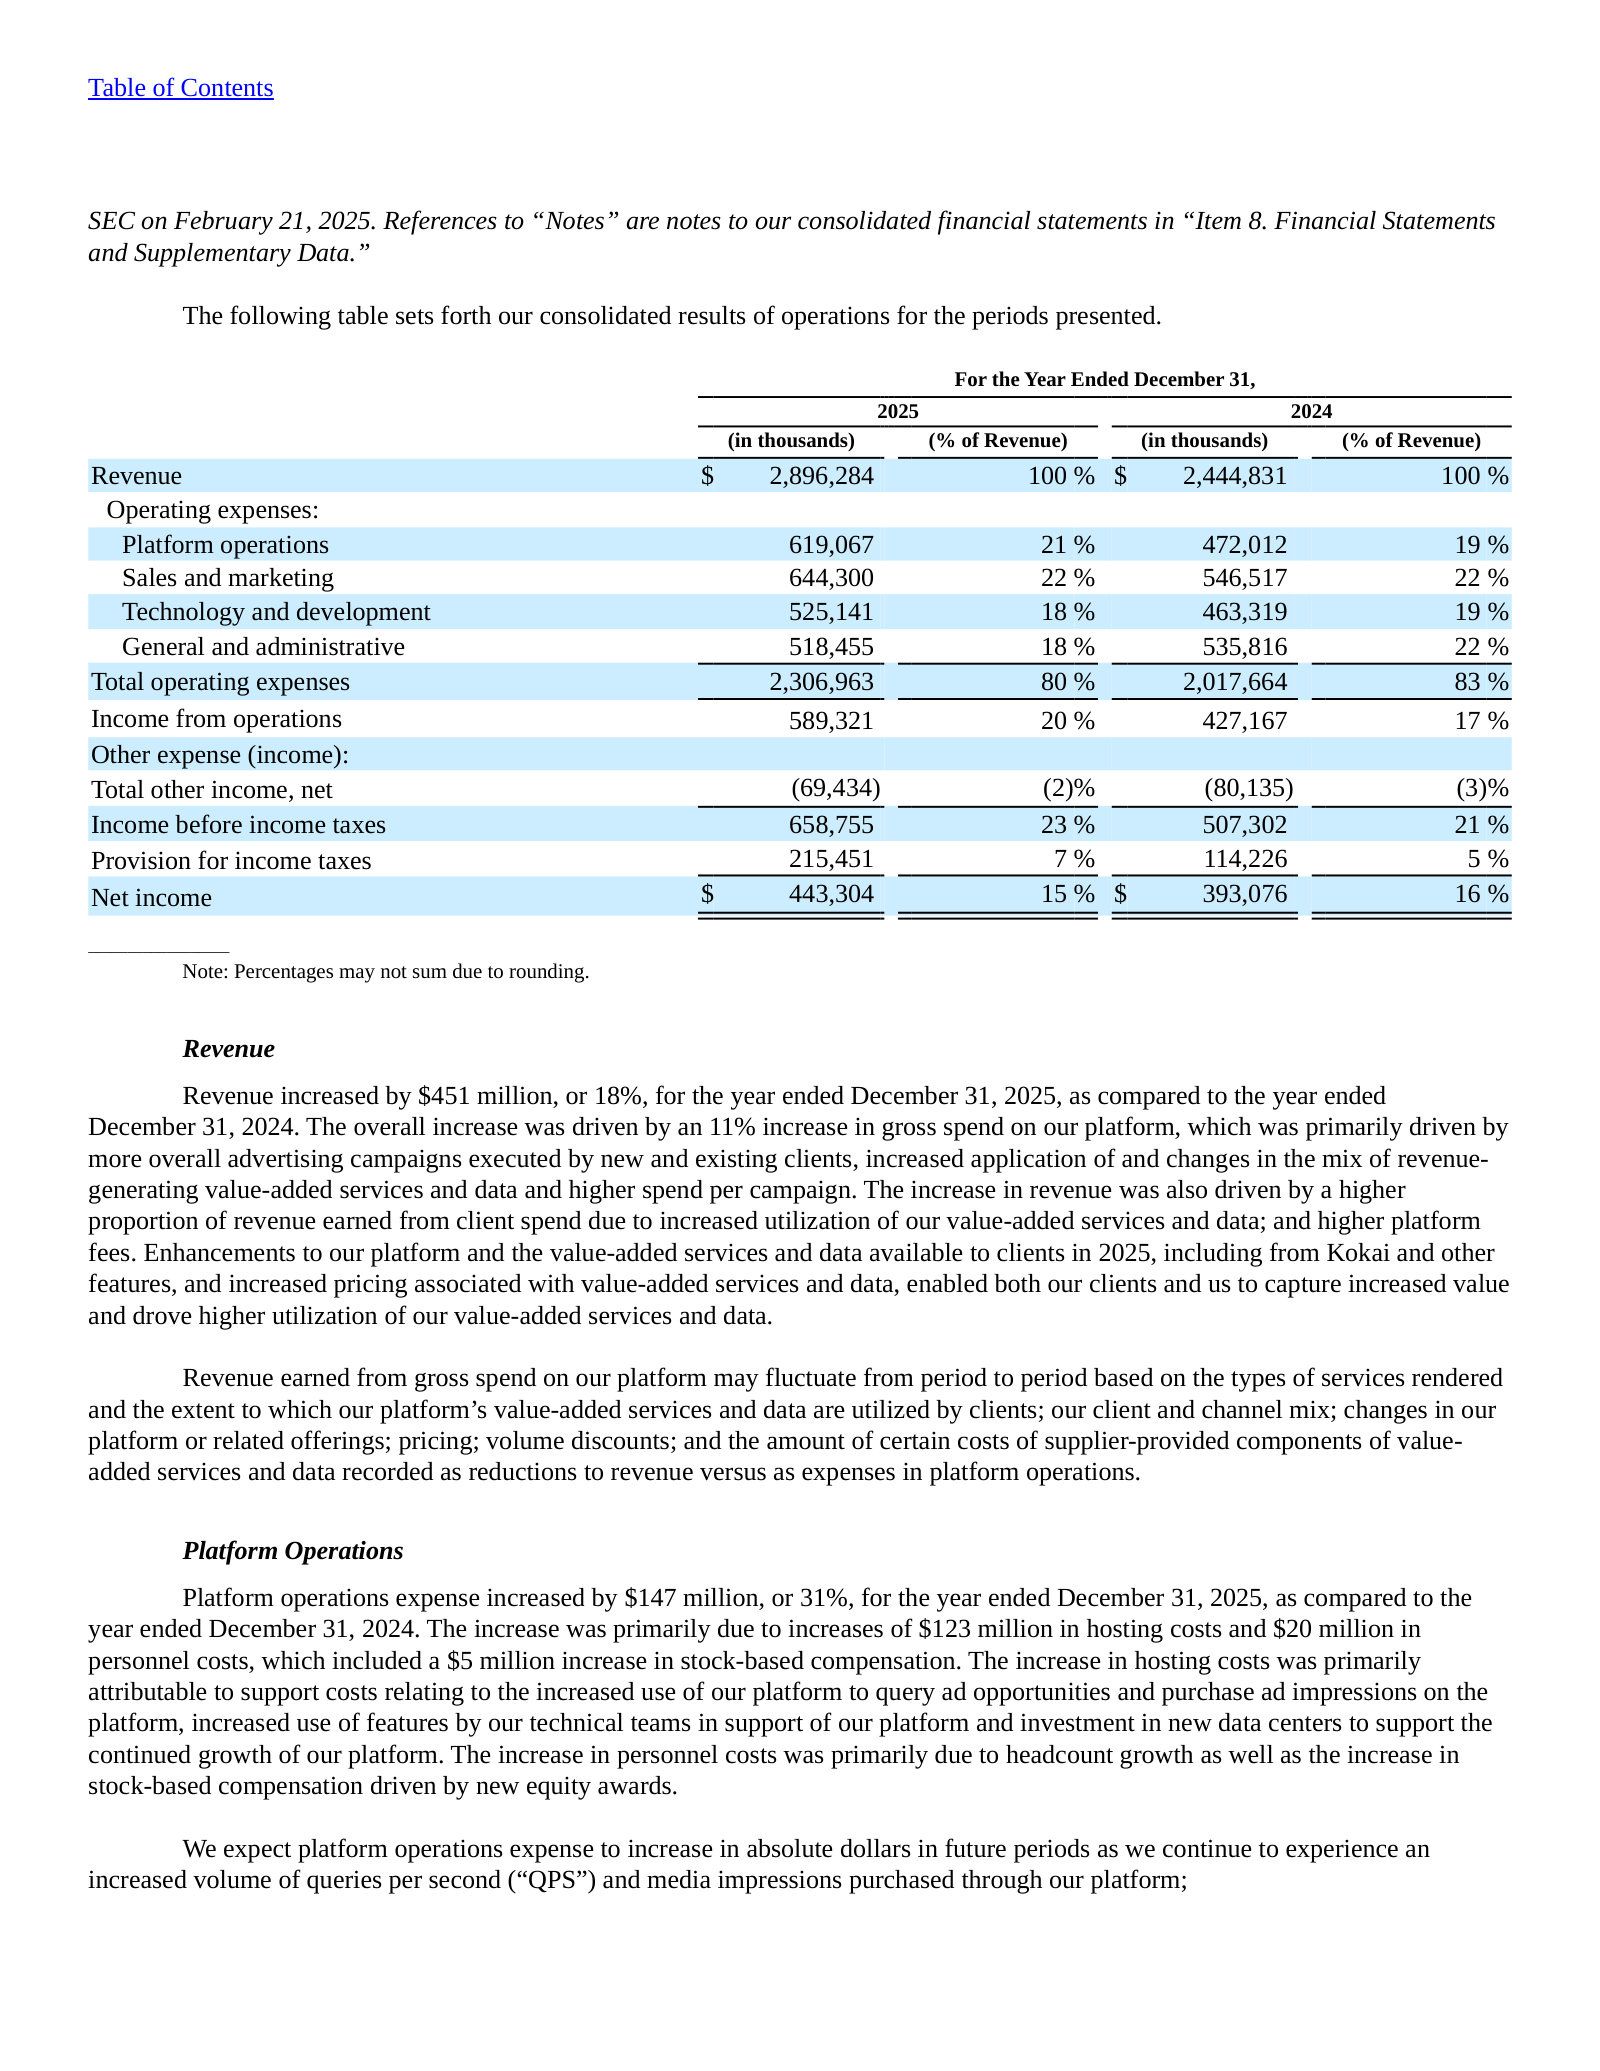
Management's explanation of the revenue-versus-spend gap: mix, utilization and pricing of value-added services and data.
Revenue increased by $451 million, or 18%, for the year ended December 31, 2025, as compared to the year ended December 31, 2024. The overall increase was driven by an 11% increase in gross spend on our platform, which was primarily driven by more overall advertising campaigns executed by new and existing clients, […] The increase in revenue was also driven by a higher proportion of revenue earned from client spend due to increased utilization of our value-added services and data; and higher platform fees. […] increased pricing associated with value-added services and data, enabled both our clients and us to capture increased value and drove higher utilization of our value-added services and data.
p. 87 · Read in context →
Note 12—Segment and Geographic Information — p. 145 · Read the full section →
Why there is no segment detail to analyze: one segment, the CEO reviews consolidated results only, and the US is 86% of revenue.
One reportable segment, and the disclosure that the CODM sees no expense detail below the income statement.
The Company’s chief operating decision maker is its Chief Executive Officer (“CEO”), who manages the Company and reviews financial information on a consolidated basis. The Company has one primary business activity, its advertising technology platform, as described in Note 1 – Nature of Operations. The platform is used by clients globally in a similar manner across geographies, channels and verticals. Accordingly, the Company operates in one operating segment on a consolidated basis: advertising technology platform. […] The CEO is not regularly provided significant expense information at a greater level of disaggregation than those expenses reported on the consolidated statements of operations.
p. 145 · Read in context →
The Trade Desk, Inc. — FY2022 Annual Report (Form 10-K) — FY2022 (year ended December 31, 2022)
Included for contrast: the pre-AI, pre-Kokai self-description, a Delaware incorporation, and a client-count metric TTD has since stopped giving. · Open the full document →
Item 1. Business — Overview — p. 6 · Read the full section →
The same business three years earlier: a "self-service, cloud-based ad-buying platform," no AI framing, and a Delaware corporation.
FY2022 self-description and fee model, against FY2025's "global leader in advertising technology."
The Trade Desk, Inc. (the “Company,” “we,” “our,” or “The Trade Desk”) offers a self-service, cloud-based ad-buying platform that empowers our clients to plan, manage, optimize and measure more expressive data-driven digital advertising campaigns. […] Our clients are advertising agencies, brands and other service providers for advertisers, with whom we enter into ongoing master services agreements (“MSAs”). We generate revenue by charging our clients a platform fee based on a percentage of a client’s total spend on advertising. We also generate revenue from providing data and other value-added services and platform features. […] The Trade Desk is a Delaware corporation established in 2009 and headquartered in Ventura, California.
p. 6 · Read in context →
Item 1. Business — Our Clients — p. 10 · Read the full section →
A disclosure since retired: over 1,000 clients on a defined $20,000 spend threshold, where FY2025 gives only holding-company concentration.
The client-count metric and its definition, dropped from later filings.
Our clients consist of purchasers of programmatic advertising inventory and data. As of December 31, 2022, we had over 1,000 clients, consisting primarily of advertising agencies or groups within advertising agencies that have independent relationships with us, manage budgets independently of one another, are based in different jurisdictions and are served by unique Trade Desk teams. Many of these agencies are owned by holding companies, where decision making is decentralized such that purchasing decisions are made, and relationships with advertisers are located, at the agency, local branch or division level. Our client count includes only those parties that have signed MSAs with us and have spent more than $20,000 on our platform.
p. 10 · Read in context →
More annual reports
The Trade Desk, Inc. — FY2024 Annual Report (Form 10-K) — FY2024 (year ended December 31, 2024) · 102 pages · The last 10-K before the 2025 derating: revenue $2.44 billion, filed two days after the first securities class action was brought. · Open →
The Trade Desk, Inc. — FY2023 Annual Report (Form 10-K) — FY2023 (year ended December 31, 2023) · 101 pages · Revenue $1.95 billion, and the first TTD 10-K to carry an Item 1C cybersecurity disclosure. · Open →
The Trade Desk, Inc. — FY2021 Annual Report (Form 10-K) — FY2021 (year ended December 31, 2021) · 127 pages · The year the CEO Performance Option was granted — the award that drove years of G&A charges and derivative litigation. · Open →