Full Report
The numbers behind The Trade Desk, Inc.: as-reported financial statements and company metrics for FY2021–FY2025, traced to the source filings, opened with the share-price history those statements have to justify. Every linked figure opens the exact page of the filing it was printed on, with the statement row highlighted. Amounts in US$ thousands unless noted.
Reading notes: All figures are in US$ thousands, the unit The Trade Desk prints on its consolidated statements ('In thousands, except per share amounts'). Each of FY2021-FY2025 is cited to that year's own Form 10-K: income statement, balance sheet and cash-flow statement are read from the primary-year column of the filing for that year. The Trade Desk operates in a single operating segment (advertising technology platform), so the only revenue disaggregation it reports is by principal geographic area. Revenue by geography on a revenue basis was first disclosed in the FY2025 Form 10-K, which recast FY2024 and FY2023; the FY2021-FY2024 Forms 10-K disclosed geographic split on a Gross Billings basis only. FY2022 and FY2021 US/International revenue is therefore shown as not disclosed, and only the total is given for those years.
Share Price — Full Available History — 10 Years
The stock closed at $17.29 on Jul 24, 2026 — up 474% over the window shown (+19.4% a year), trading between $2.28 and $139.51. At that close the stock trades at 19× FY2025 diluted EPS as reported below.
Source: market price feed, weekly closes, sampled from 2,474 source observations, Sep 2016–Jul 2026. Price return only, excludes dividends.
Market capitalization $316mn.
Market cap = 18.3M shares outstanding × the Jul 24, 2026 close of $17.29. Market-derived, shown without filing links.
FY2025 at a Glance
Revenue (US$ thousands)
Net income (US$ thousands)
Diluted EPS
Source: FY2025 consolidated statements [1] [2] [3] [4]. Click any linked figure to open the filing page with the row highlighted.
Revenue by Geography
| Revenue by Geography | FY2021 | FY2022 | FY2023 | FY2024 | FY2025 |
|---|---|---|---|---|---|
| United States | — | — | 1,696,911 | 2,133,502 | 2,476,683 |
| International | — | — | 249,209 | 311,329 | 419,601 |
| Total revenue | 1,196,467 | 1,577,795 | 1,946,120 | 2,444,831 | 2,896,284 |
| Total revenue growth, derived | — | +31.9% | +23.3% | +25.6% | +18.5% |
Source: FY2025 Form 10-K, Note 12-Segment and Geographic Information (FY2024 and FY2023 recast to a revenue basis); FY2022 and FY2021 totals from the Consolidated Statements of Operations [5] [4] [6]. Click any linked figure to open the filing page with the row highlighted.
Income Statement
Source: Consolidated Statements of Operations, Forms 10-K FY2021-FY2025 (in thousands) [1] [2] [3] [4]. Click any linked figure to open the filing page with the row highlighted.
Columns marked E are consensus analyst estimates from S&P Capital IQ (CapIQ), shown alongside reported results for direct comparison; they are not company guidance.
Estimate source: S&P Capital IQ (CapIQ) consensus, as of 2026-07-25. Estimate figures are S&P Capital IQ consensus (vendor data — no filing page links). EPS and net income use the normalized (adjusted) consensus where the street reports it. Line-item analyst models (segments, drivers, KPIs) are in the Visible Alpha tab.
Balance Sheet
Source: Consolidated Balance Sheets, Forms 10-K FY2021-FY2025 (in thousands) [7] [8] [9] [10]. Click any linked figure to open the filing page with the row highlighted.
Cash Flow
Source: Consolidated Statements of Cash Flows, Forms 10-K FY2021-FY2025 (in thousands) [11] [12] [13] [14]. Click any linked figure to open the filing page with the row highlighted.
Client Franchise Concentration
| Client Franchise Concentration | FY2021 | FY2022 | FY2023 | FY2024 | FY2025 |
|---|---|---|---|---|---|
| Clients on the platform (last disclosed FY2023) | 980 | 1,000 | 1,100 | — | — |
| Client retention rate (disclosed as over) | 95.0% | 95.0% | 95.0% | 95.0% | — |
| Agency holding companies above 10% of Gross Billings | 2 | 1 | 1 | 1 | 2 |
| Largest holding company - share of Gross Billings | 11.0% | 11.0% | 12.0% | 14.0% | — |
| Two largest holding companies combined - share of Gross Billings | — | — | — | — | 30.0% |
| Clients at 10%+ of accounts receivable - combined share | 41.0% | 49.0% | 31.0% | 42.0% | 30.0% |
Source: company filings [15] [16] [17] [18]. Click any linked figure to open the filing page with the row highlighted.
Geographic Footprint
| Geographic Footprint | FY2021 | FY2022 | FY2023 | FY2024 | FY2025 |
|---|---|---|---|---|---|
| Gross Billings - United States | 5,286,191 | 6,696,743 | 8,216,446 | 10,244,266 | — |
| Gross Billings - International | 843,436 | 937,824 | 1,214,207 | 1,508,501 | — |
| Countries with employees | 19 | 19 | 19 | 20 | 21 |
| North America - share of workforce | 65.0% | 63.0% | 64.0% | 64.0% | 63.0% |
| EMEA - share of workforce | 18.0% | 19.0% | 19.0% | 19.0% | 20.0% |
| APAC - share of workforce | 17.0% | 18.0% | 17.0% | 17.0% | 17.0% |
Source: company filings [19] [20] [21] [22]. Click any linked figure to open the filing page with the row highlighted.
Cost Structure (% of revenue, as reported)
| Cost Structure (% of revenue, as reported) | FY2021 | FY2022 | FY2023 | FY2024 | FY2025 |
|---|---|---|---|---|---|
| Platform operations (% of revenue) | 19.0% | 18.0% | 19.0% | 19.0% | 21.0% |
| Sales and marketing (% of revenue) | 21.0% | 21.0% | 23.0% | 22.0% | 22.0% |
| Technology and development (% of revenue) | 19.0% | 20.0% | 21.0% | 19.0% | 18.0% |
| General and administrative (% of revenue) | 31.0% | 33.0% | 27.0% | 22.0% | 18.0% |
| Income from operations (% of revenue) | 10.0% | 7.0% | 10.0% | 17.0% | 20.0% |
Source: company filings [23] [24] [25] [26]. Click any linked figure to open the filing page with the row highlighted.
Growth Non-GAAP Performance
| Growth Non-GAAP Performance | FY2021 | FY2022 | FY2023 | FY2024 | FY2025 |
|---|---|---|---|---|---|
| Gross spend growth year over year | 47.0% | 25.0% | 24.0% | 25.0% | 11.0% |
| Adjusted EBITDA margin | 42.0% | 42.0% | 40.0% | 41.0% | — |
| Non-GAAP net income | 455,556 | 522,032 | 628,099 | 832,303 | 873,080 |
| Non-GAAP diluted earnings per share | 0.91 | 1.04 | 1.26 | 1.66 | 1.77 |
Source: company filings [27] [28] [29] [30]. Click any linked figure to open the filing page with the row highlighted.
Capital Returns Share Count
| Capital Returns Share Count | FY2021 | FY2022 | FY2023 | FY2024 | FY2025 |
|---|---|---|---|---|---|
| Class A shares repurchased and retired | — | — | 10,000,000 | 2,500,000 | 26,200,000 |
| Repurchase authorization remaining at year-end | — | — | 53,000 | 464,000 | 150,000 |
| Class A shares outstanding (January 31 after year-end) | 440,597,630 | 446,505,568 | 445,017,931 | 452,425,879 | 432,868,418 |
| Class B shares outstanding (January 31 after year-end) | 44,234,950 | 44,289,230 | 43,918,900 | 43,662,678 | 43,108,629 |
Source: company filings [31] [32] [33] [34]. Click any linked figure to open the filing page with the row highlighted.
Long-Term Record
| Fiscal year | Revenue | Income from operations | Net income | Diluted earnings per share | Net cash provided by operating activities | Purchases of property and equipment |
|---|---|---|---|---|---|---|
| FY2016 | 202,926 | 57,518 | 20,482 | — | 75,031 | (6,884) |
| FY2017 | 308,217 | 69,356 | 50,798 | — | 31,224 | (10,110) |
| FY2018 | 477,294 | 107,323 | 88,140 | — | 86,603 | (19,795) |
| FY2019 | 661,058 | 112,196 | 108,318 | 0.23 | 60,205 | (35,693) |
| FY2020 | 836,033 | 144,208 | 242,317 | 0.49 | 405,069 | (74,061) |
| FY2021 | 1,196,467 | 124,817 | 137,762 | 0.28 | 378,513 | (54,804) |
| FY2022 | 1,577,795 | 113,654 | 53,385 | 0.11 | 548,734 | (84,160) |
| FY2023 | 1,946,120 | 200,480 | 178,940 | 0.36 | 598,322 | (46,790) |
| FY2024 | 2,444,831 | 427,167 | 393,076 | 0.78 | 739,456 | (98,238) |
| FY2025 | 2,896,284 | 589,321 | 443,304 | 0.90 | 992,721 | (197,011) |
Source: consolidated statements across filings; older years from the standardized feed [11] [1] [12] [2]. Click any linked figure to open the filing page with the row highlighted.
Operating KPIs
| KPI | FY2021 | FY2022 | FY2023 | FY2024 | FY2025 |
|---|---|---|---|---|---|
| Gross spend | 6,172,000 | 7,741,000 | 9,611,000 | 12,040,872 | 13,394,683 |
| Adjusted EBITDA | 502,698 | 667,682 | 771,526 | 1,010,649 | 1,196,449 |
| Full-time employees | 1,967 | 2,770 | 3,115 | 3,522 | 3,843 |
Source: company-reported operating metrics [27] [29] [35] [36]. Click any linked figure to open the filing page with the row highlighted.
Analyst Consensus
Mean target
Median target
High target
Low target
Street ratings: 11 strong buy, 2 buy, 19 hold, 1 sell, 3 strong sell. Consensus: Hold.
Estimate source: S&P Capital IQ (CapIQ) consensus, as of 2026-07-25. Estimate figures are S&P Capital IQ consensus (vendor data — no filing page links). EPS and net income use the normalized (adjusted) consensus where the street reports it. Line-item analyst models (segments, drivers, KPIs) are in the Visible Alpha tab.
Traceability
499 of 516 figures on this page (97%) link to the filing page where they are printed — click a linked figure to open the source PDF at that page with the row highlighted. Unlinked figures come from standardized data feeds or pre-filing years.
All figures are in US$ thousands, the unit The Trade Desk prints on its consolidated statements ('In thousands, except per share amounts').
Each of FY2021-FY2025 is cited to that year's own Form 10-K: income statement, balance sheet and cash-flow statement are read from the primary-year column of the filing for that year.
The Trade Desk operates in a single operating segment (advertising technology platform), so the only revenue disaggregation it reports is by principal geographic area.
Revenue by geography on a revenue basis was first disclosed in the FY2025 Form 10-K, which recast FY2024 and FY2023; the FY2021-FY2024 Forms 10-K disclosed geographic split on a Gross Billings basis only. FY2022 and FY2021 US/International revenue is therefore shown as not disclosed, and only the total is given for those years.
FY2016-FY2018 long-term figures come from the standardized data feed (SEC XBRL) and carry no page links. FY2019 and FY2020 are cited to the comparative columns of the FY2021 Form 10-K.
The Trade Desk carries no borrowings on its balance sheet in any year shown, so no debt lines appear on the balance-sheet statement.
Repurchases of Class A common stock are shown as zero for FY2021 and FY2022: the buyback programme began in 2023 and the line does not appear in the FY2021 or FY2022 Forms 10-K cash-flow statements, so those two cells carry no citation.
Quarterly Q4 figures are not filed on a stand-alone 10-Q. Q4 FY24 income-statement figures are cited to the Form 8-K earnings exhibit filed 12 February 2025 and Q4 FY25 to the fourth-quarter 2025 earnings release of 25 February 2026; Q4 balance sheets are cited to the corresponding Form 10-K.
Quarterly cash flows are derived from printed year-to-date statements except Q1 FY25 and Q1 FY26, which are printed three-month statements. Every derived quarter reconciles exactly to the two printed year-to-date figures and matches data/financials/cash_flow_quarterly.json where that file carries the quarter.
No stock split occurred inside the quarterly window, so quarterly per-share figures are on the current share basis as printed.
2 figure(s) differed between the data feed and the filing; the filing value is shown (see the run's metrics/metrics_tab.json for the audit trail).
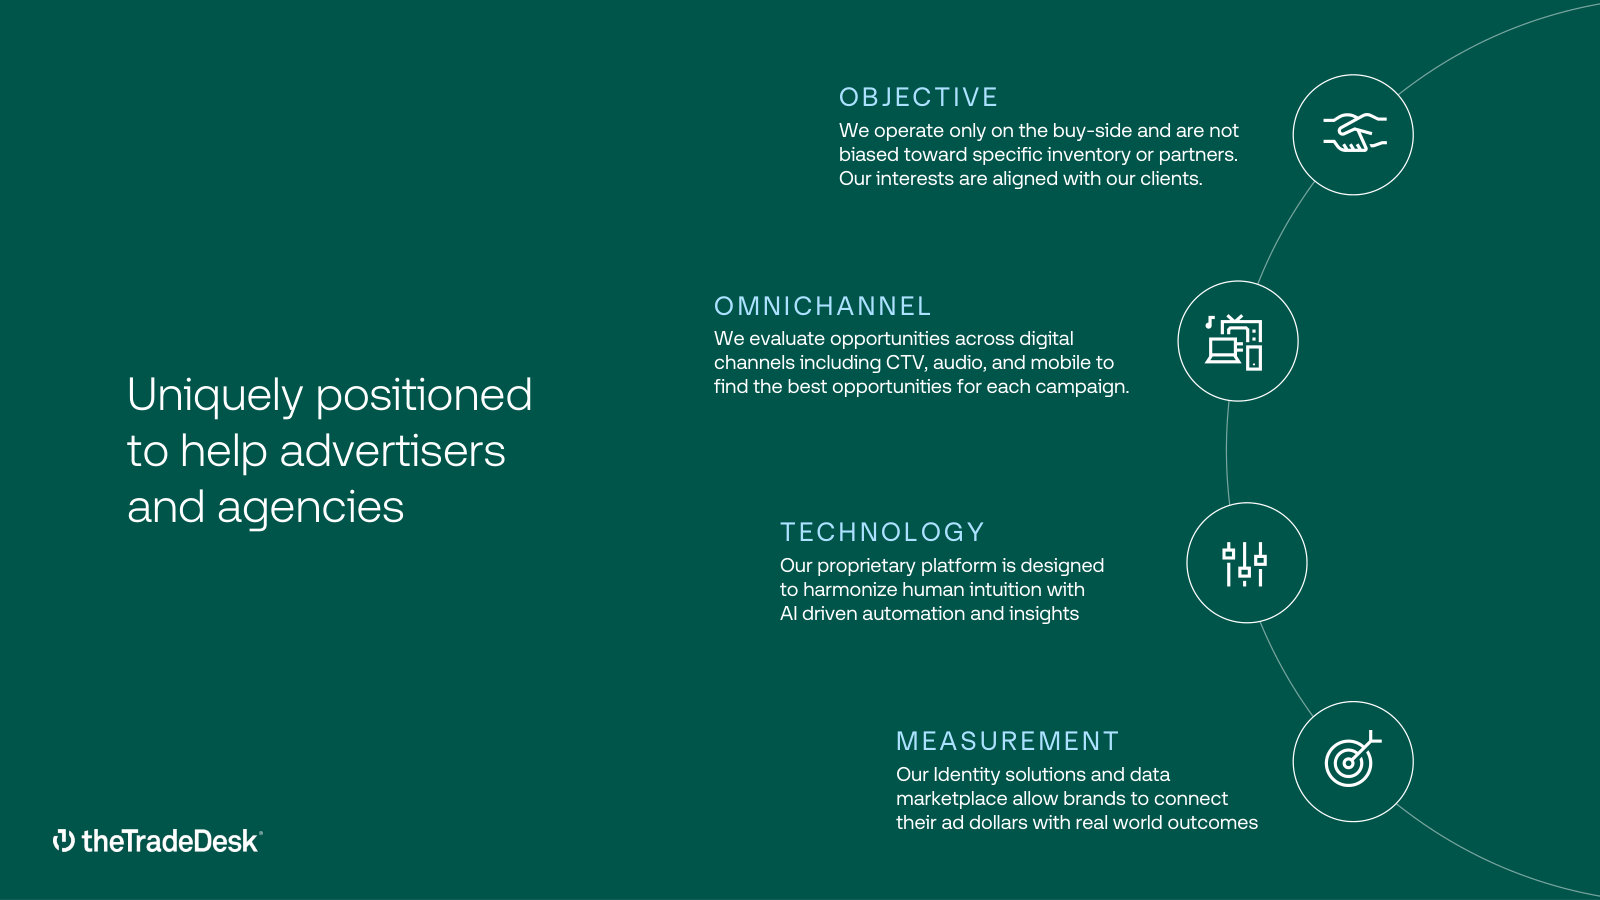
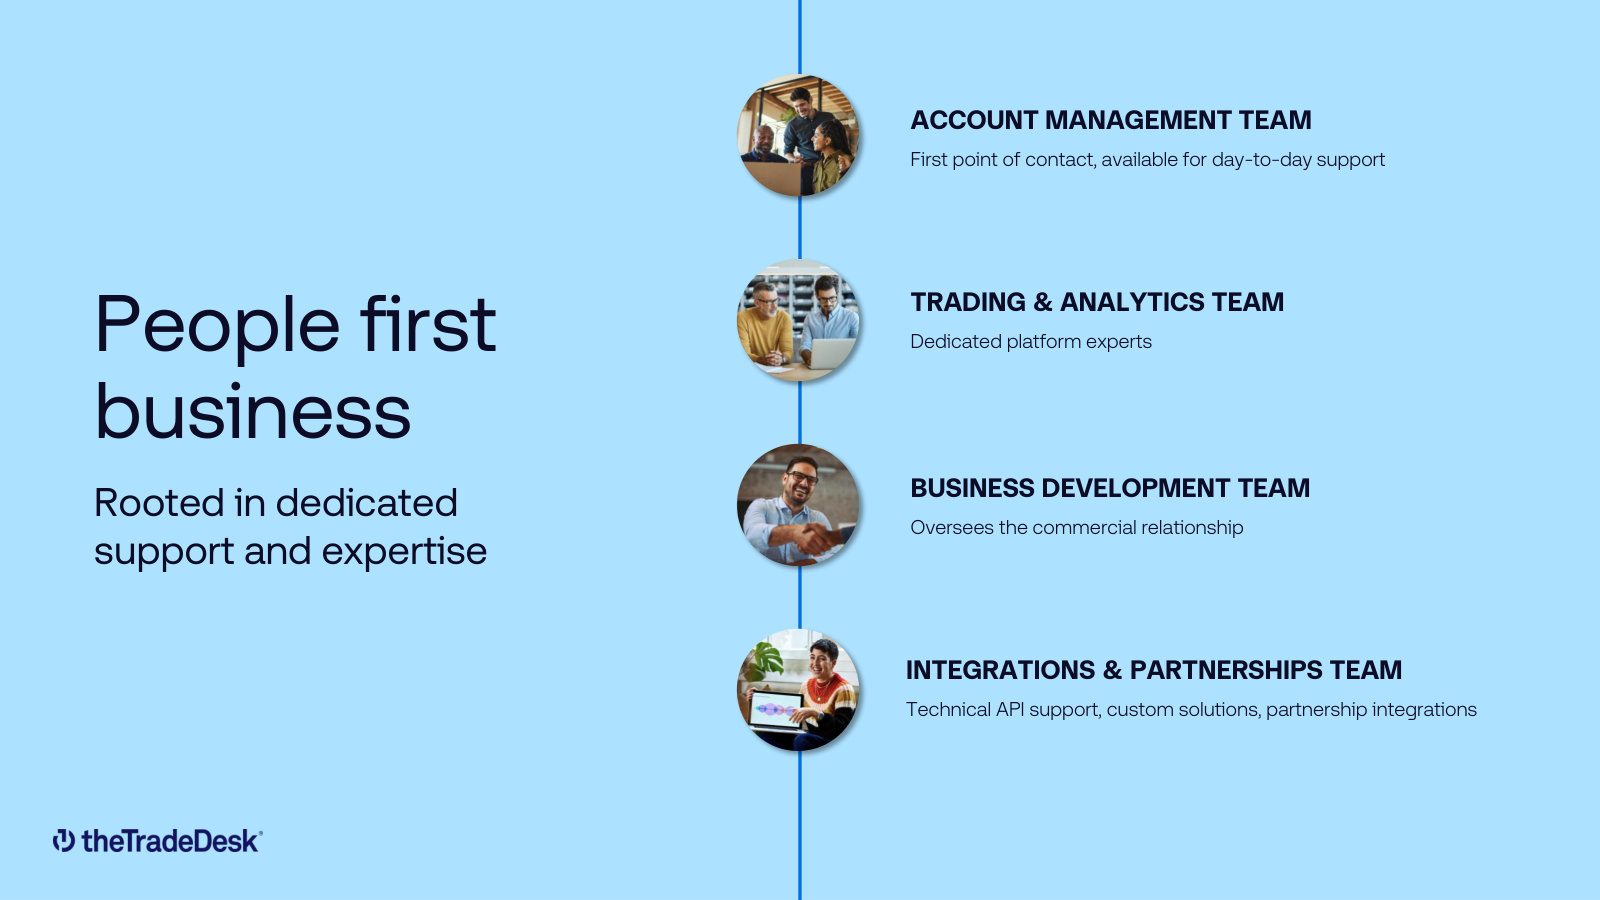
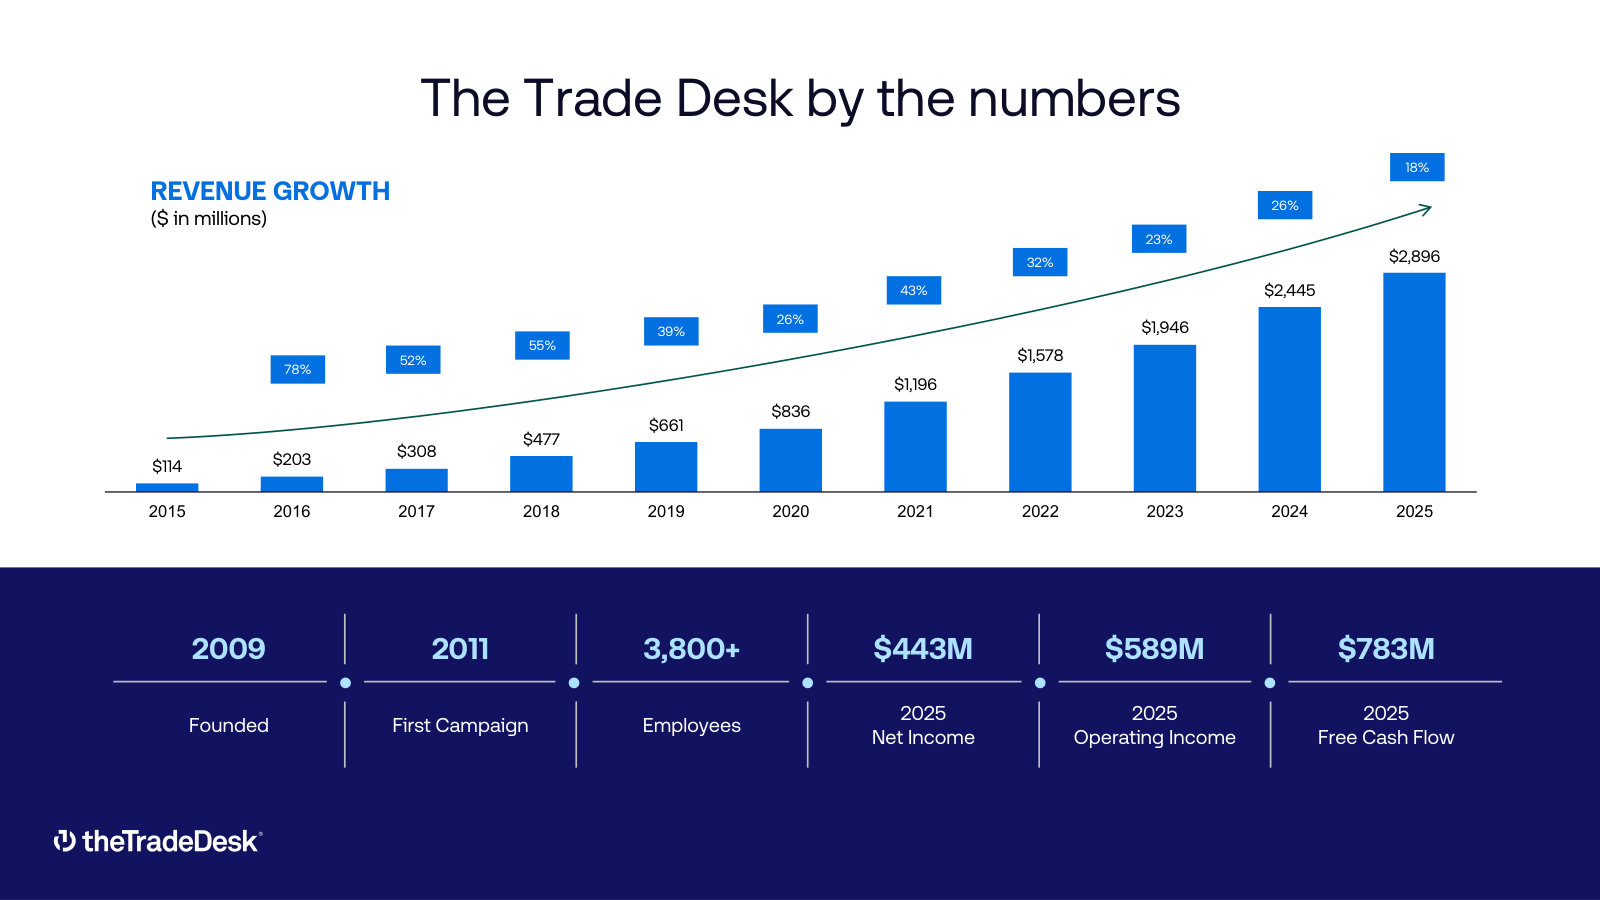
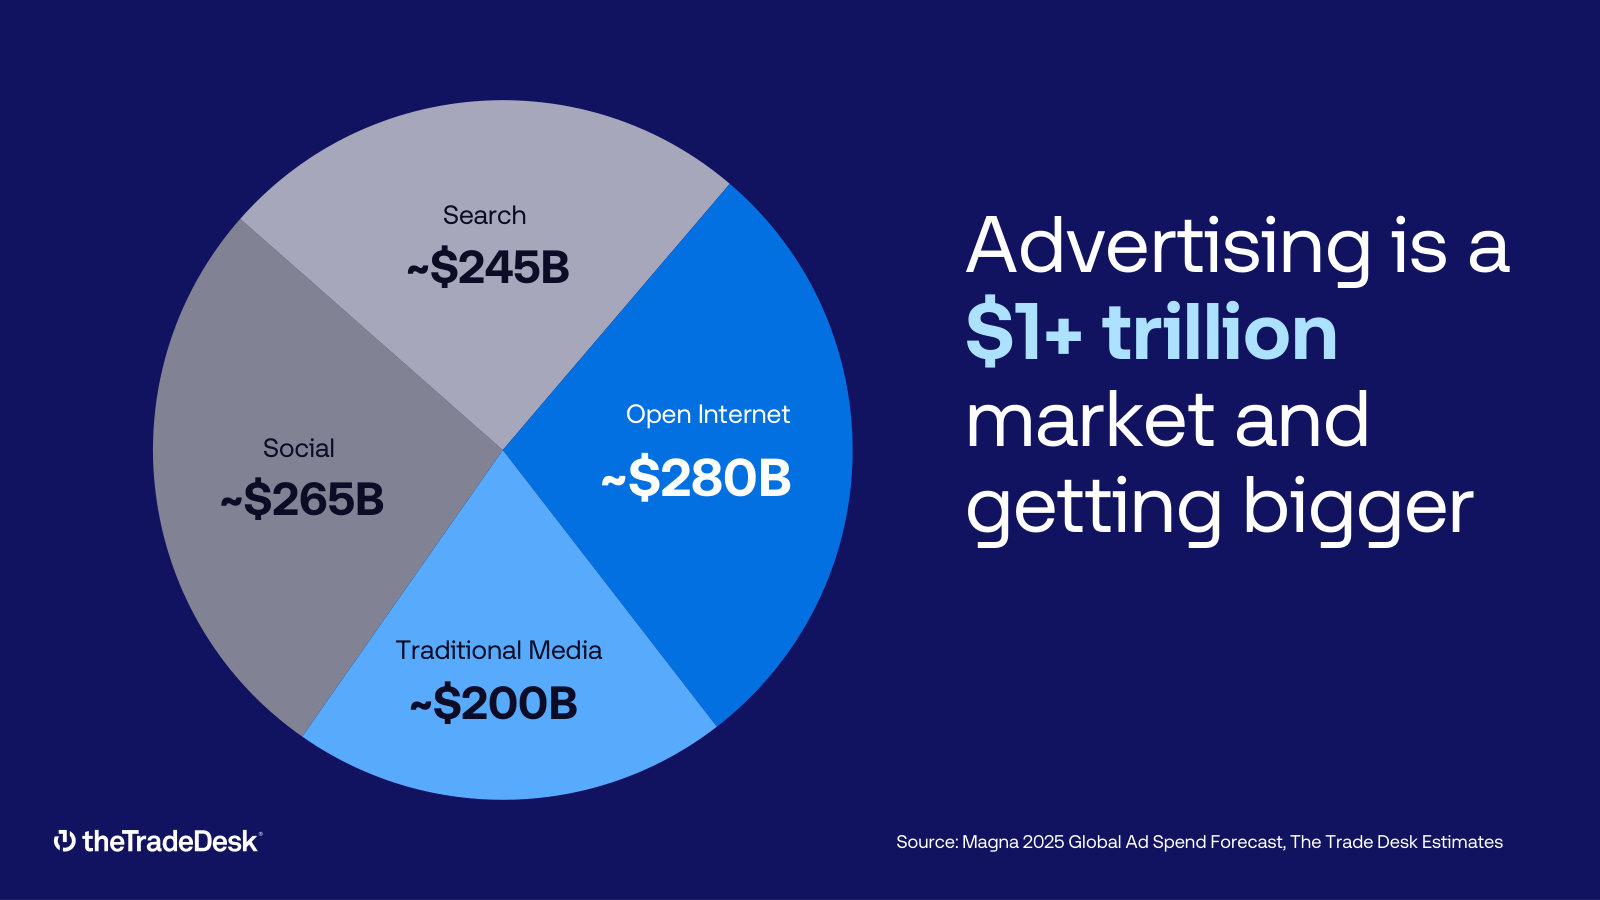
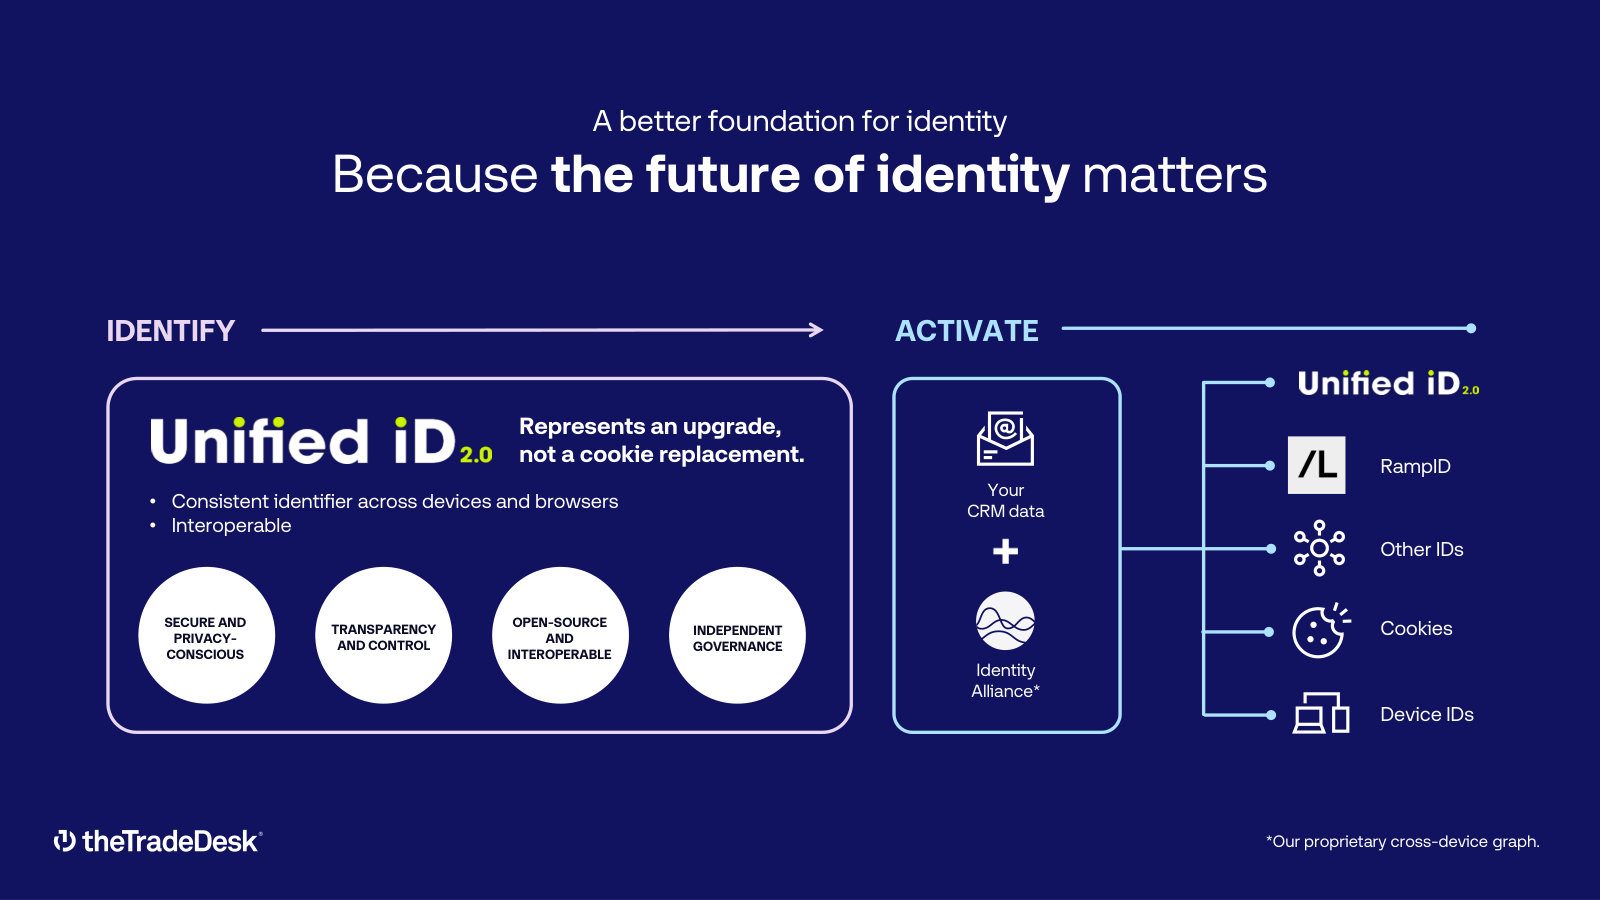
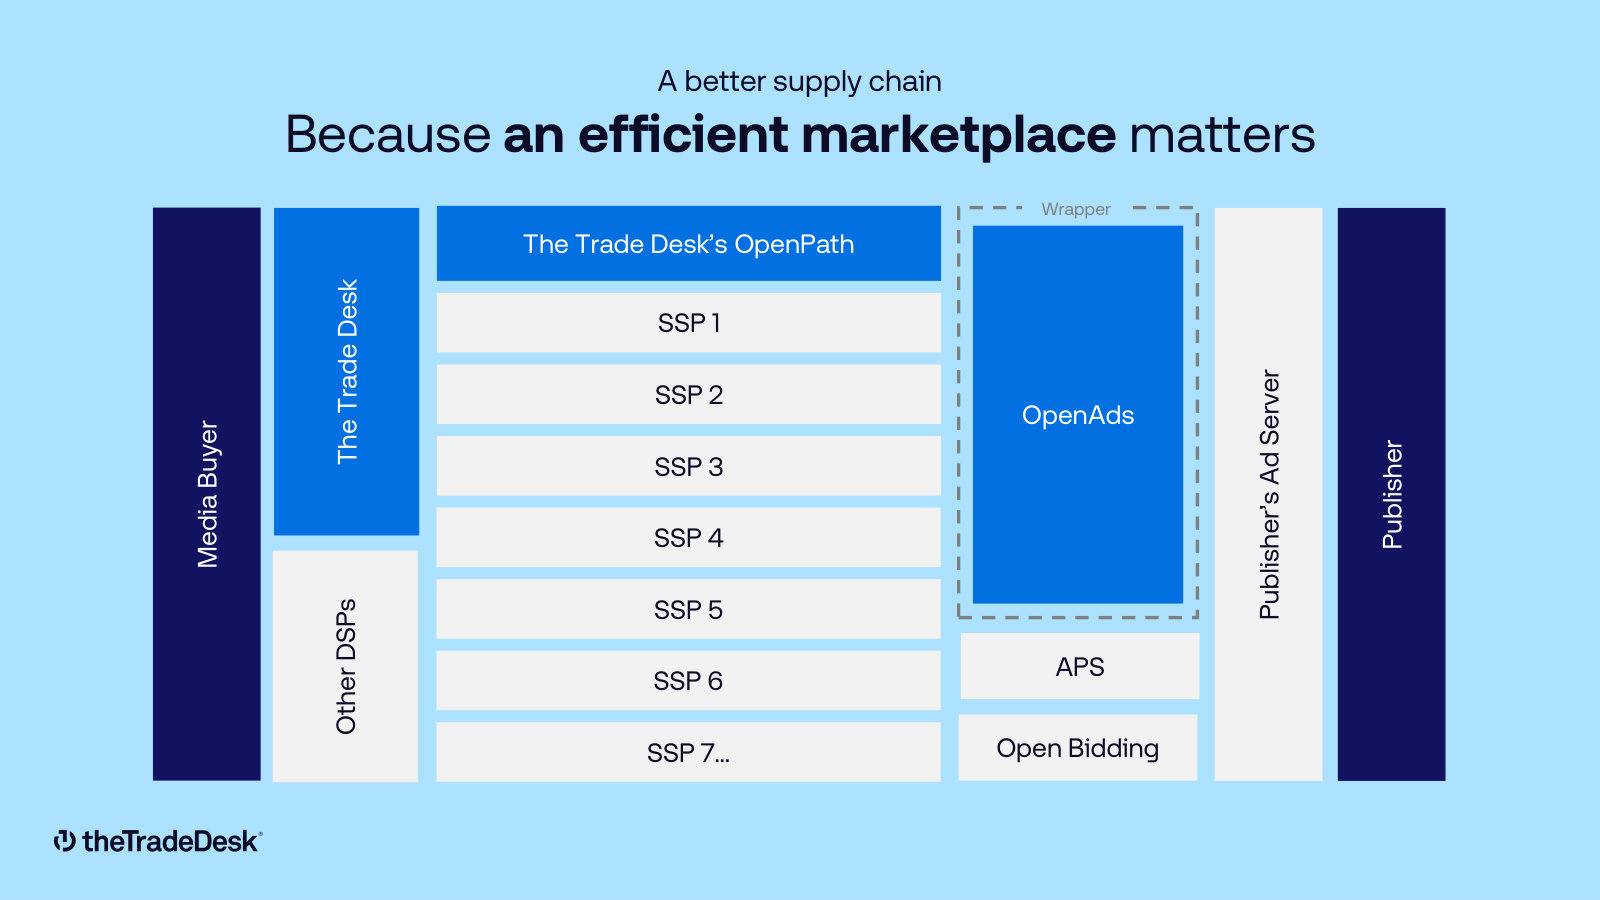
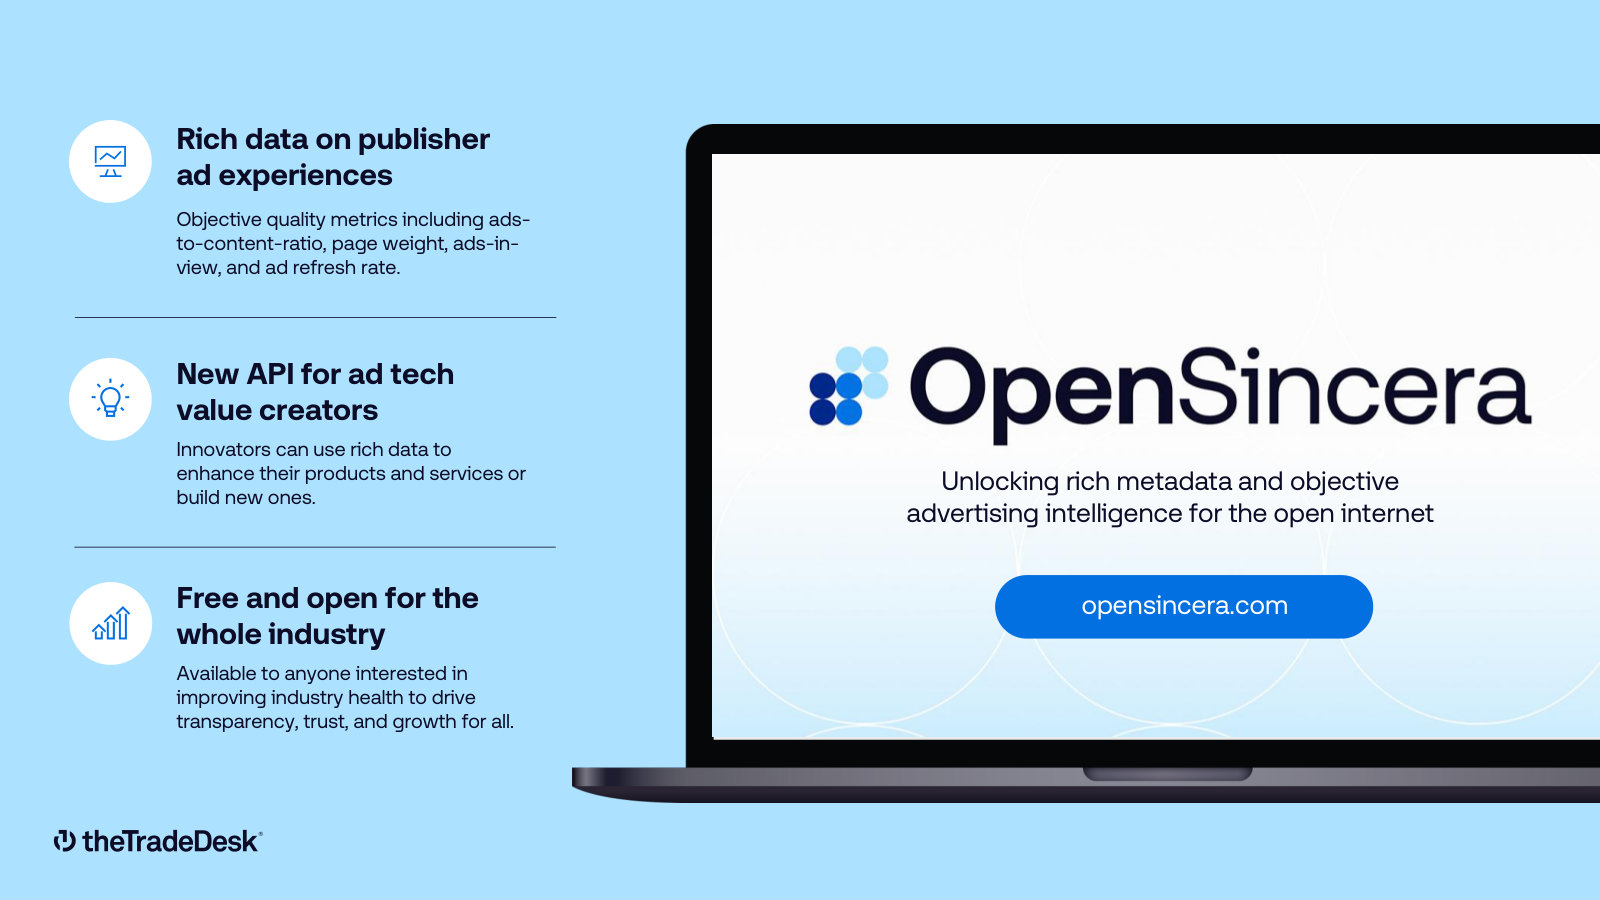
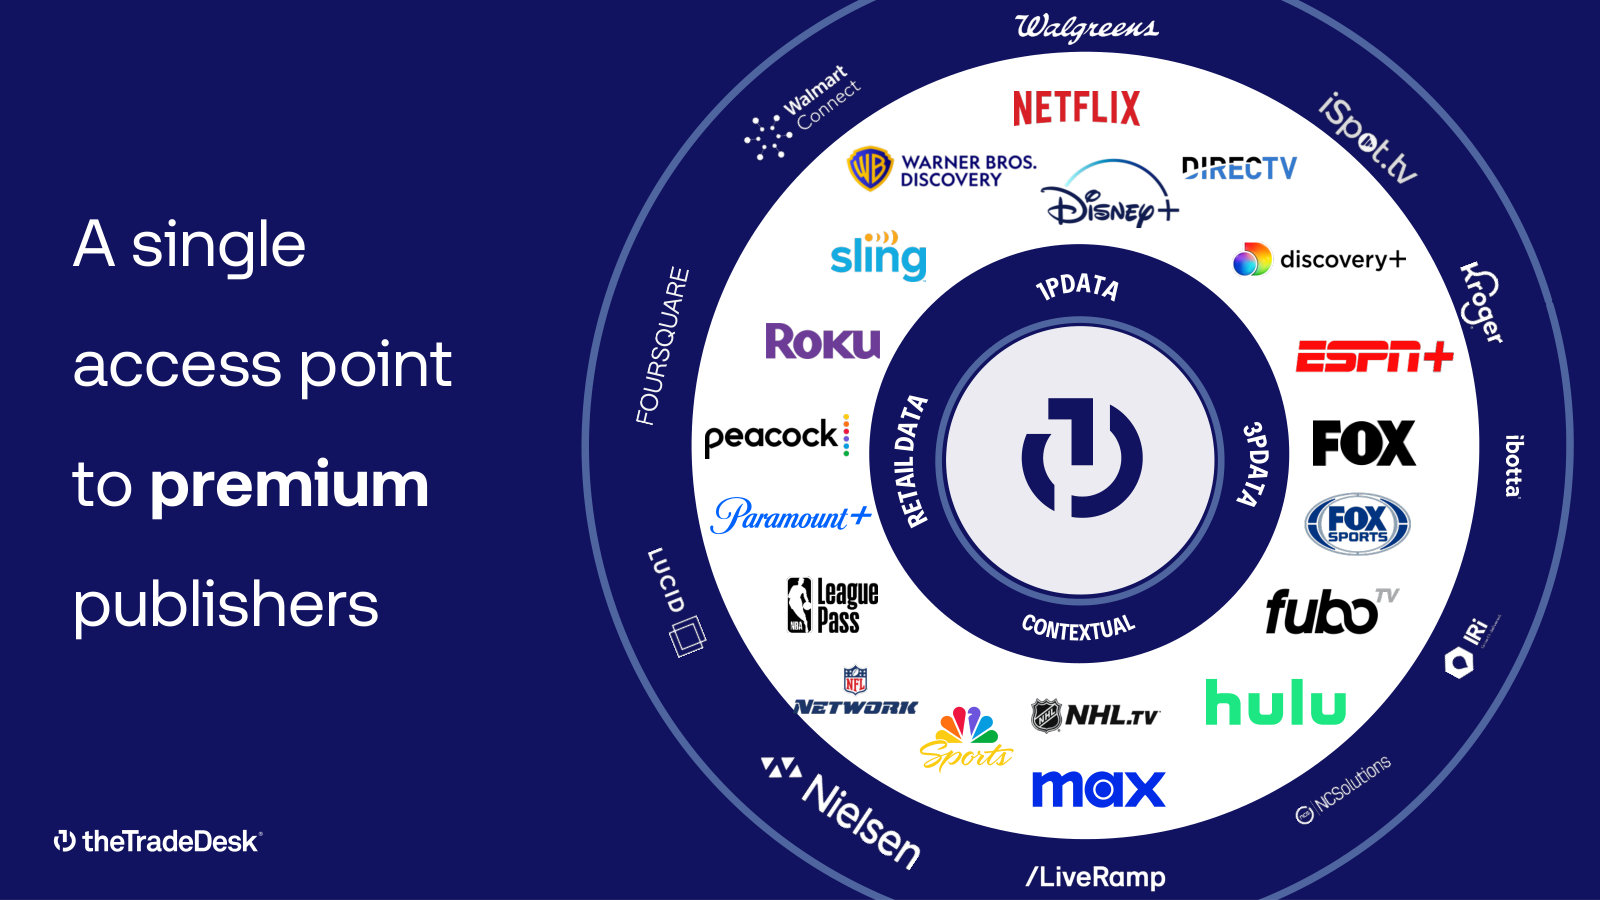
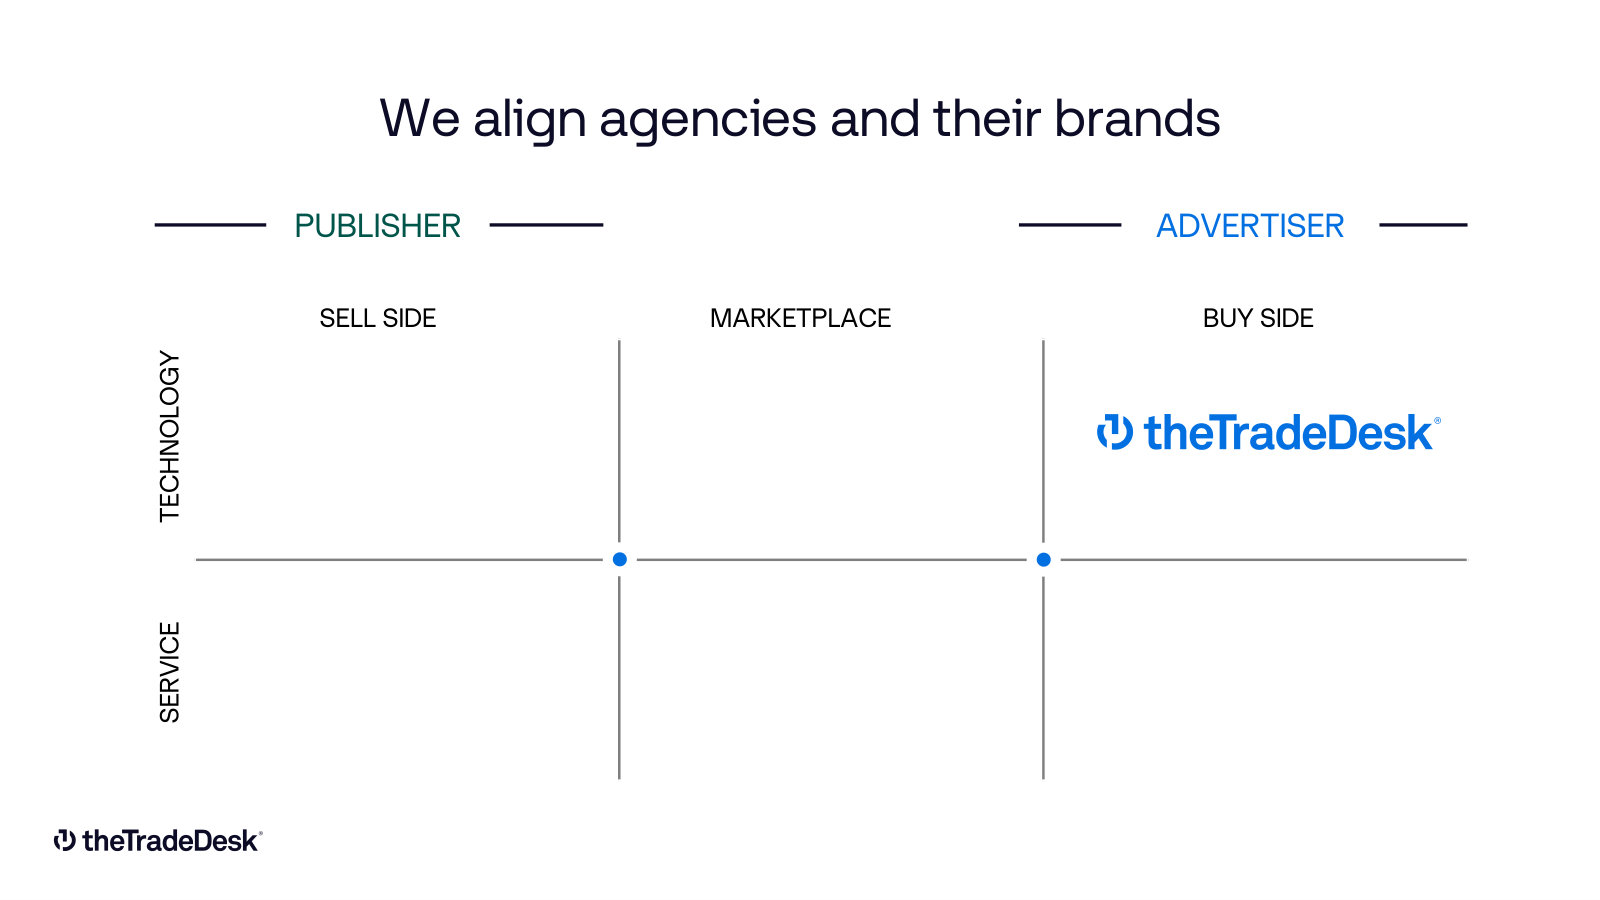
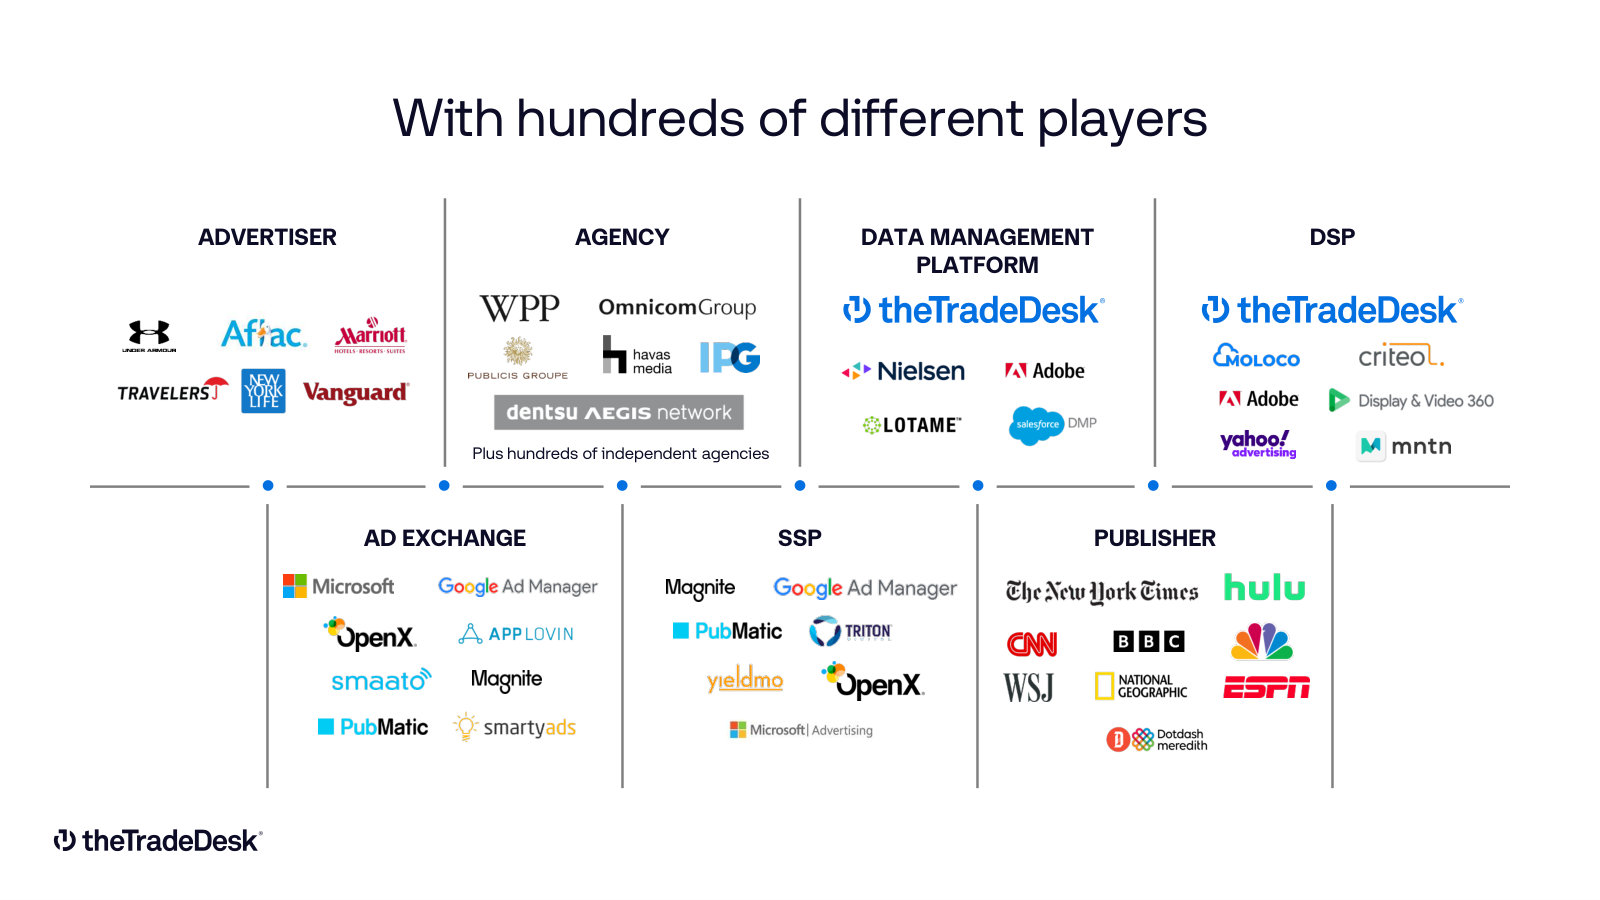
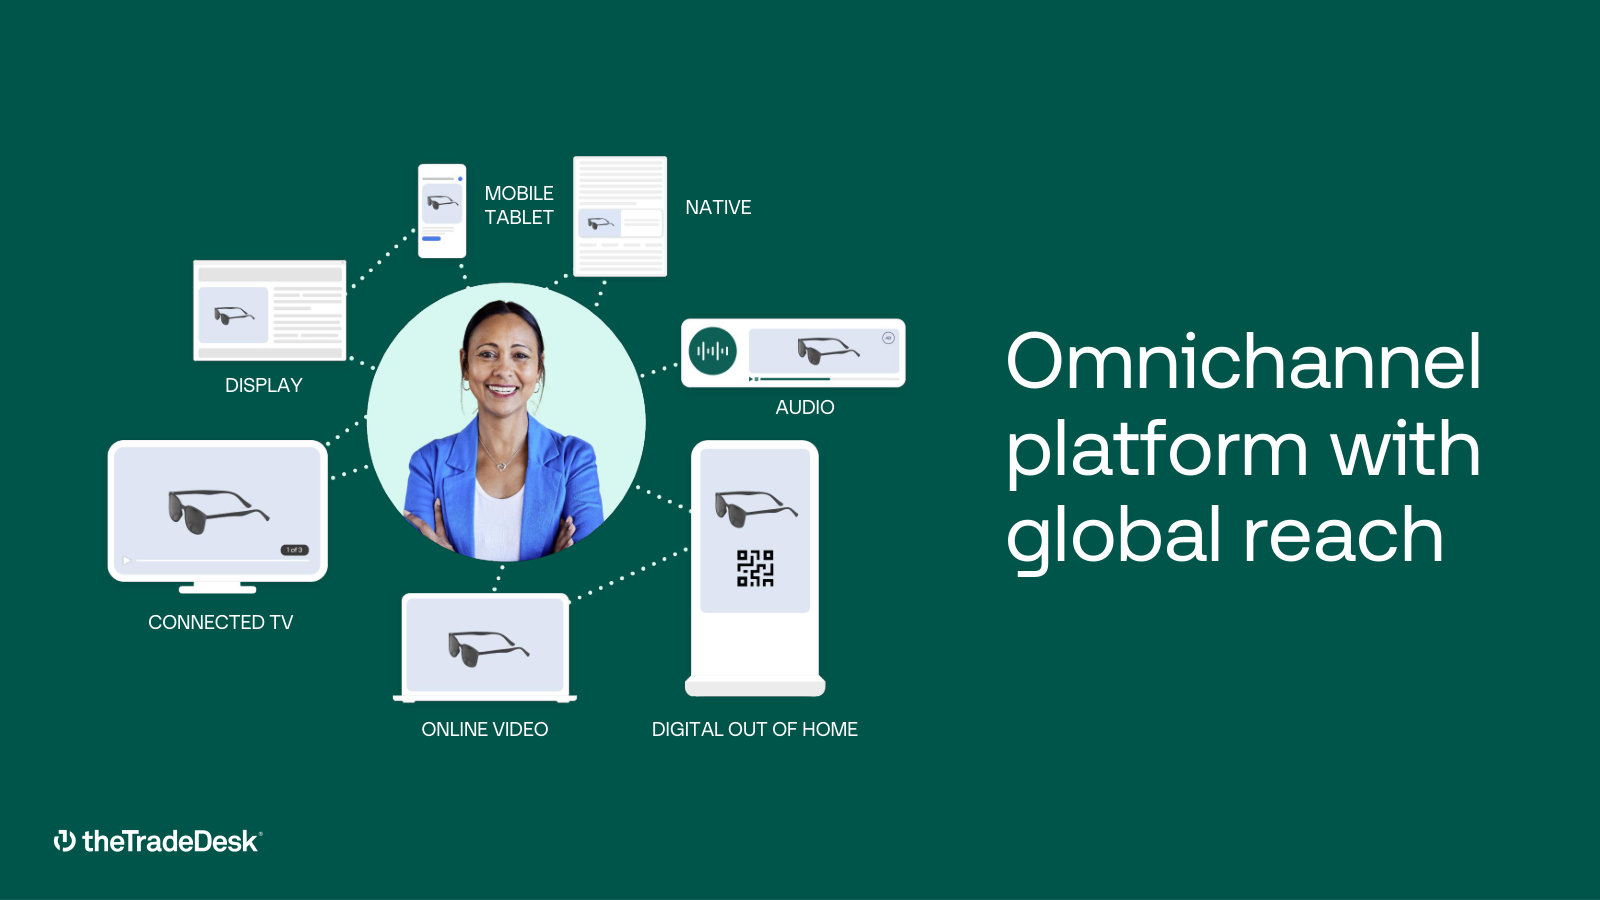
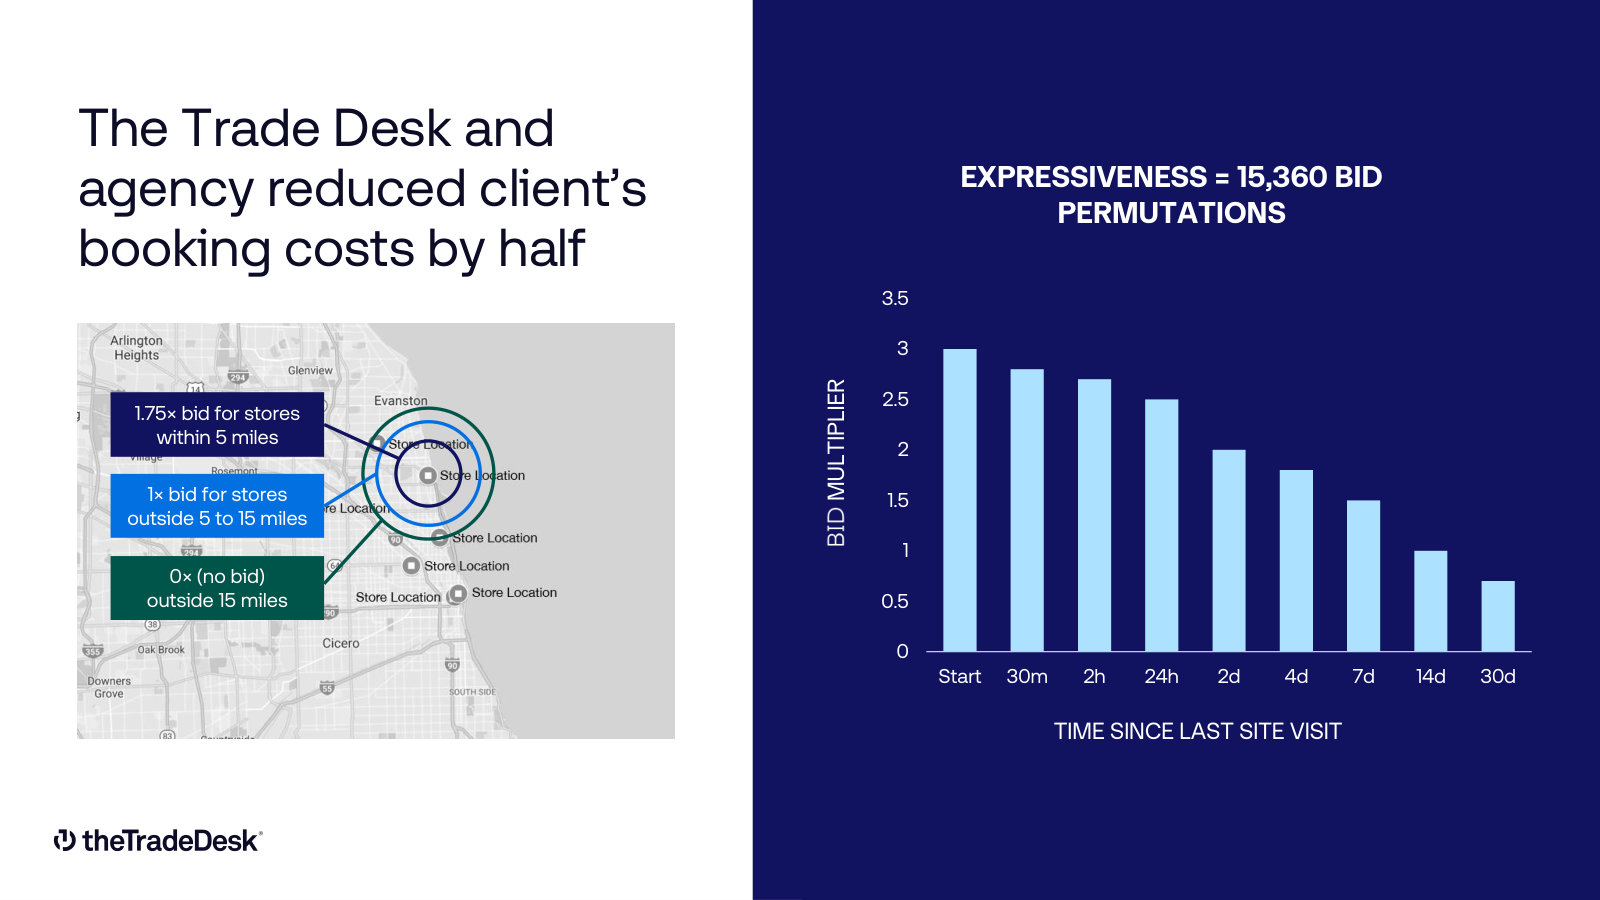
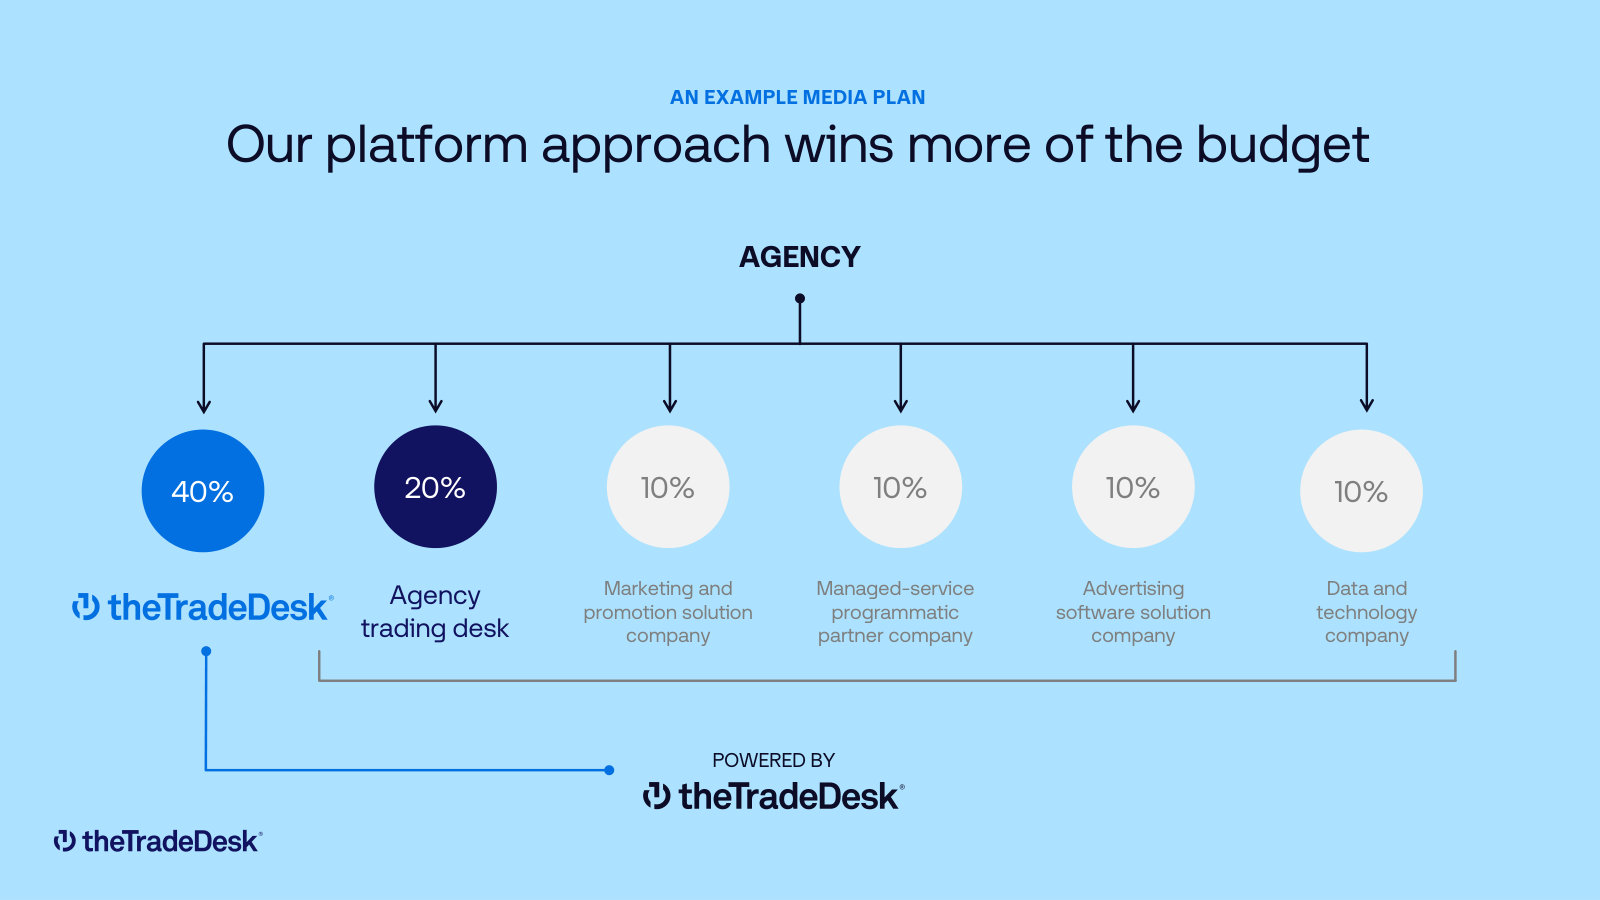
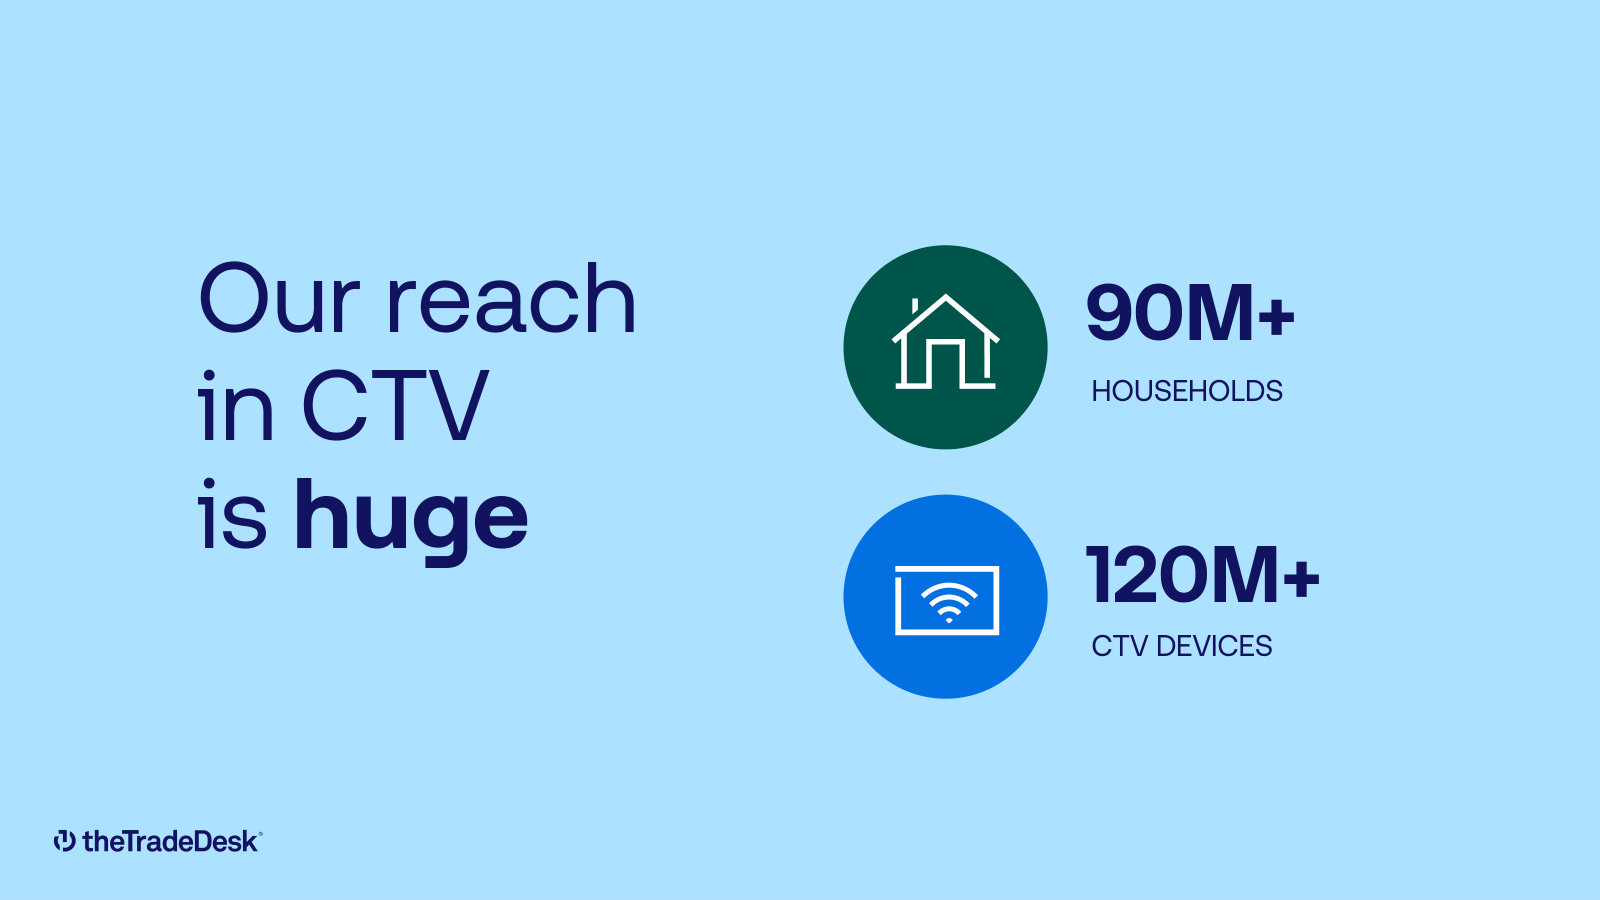
The Trade Desk, Inc.'s management explains the business in its own materials. The slides below do the most of that work, pulled from the documents preserved in Sources. Each source link opens the complete presentation at that slide in a new tab.
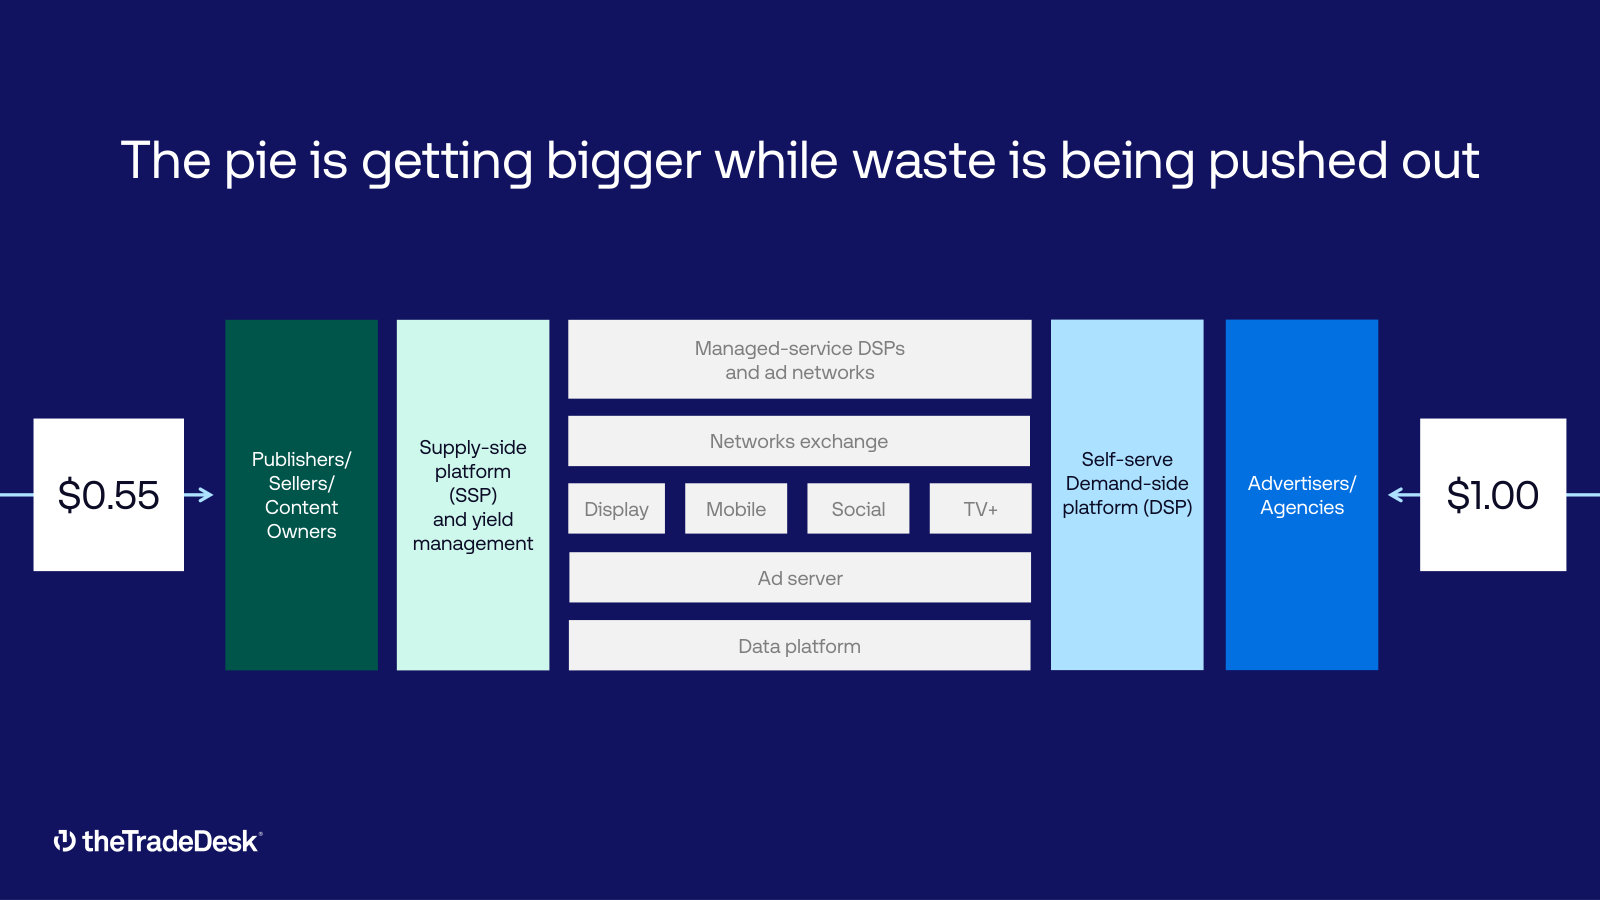
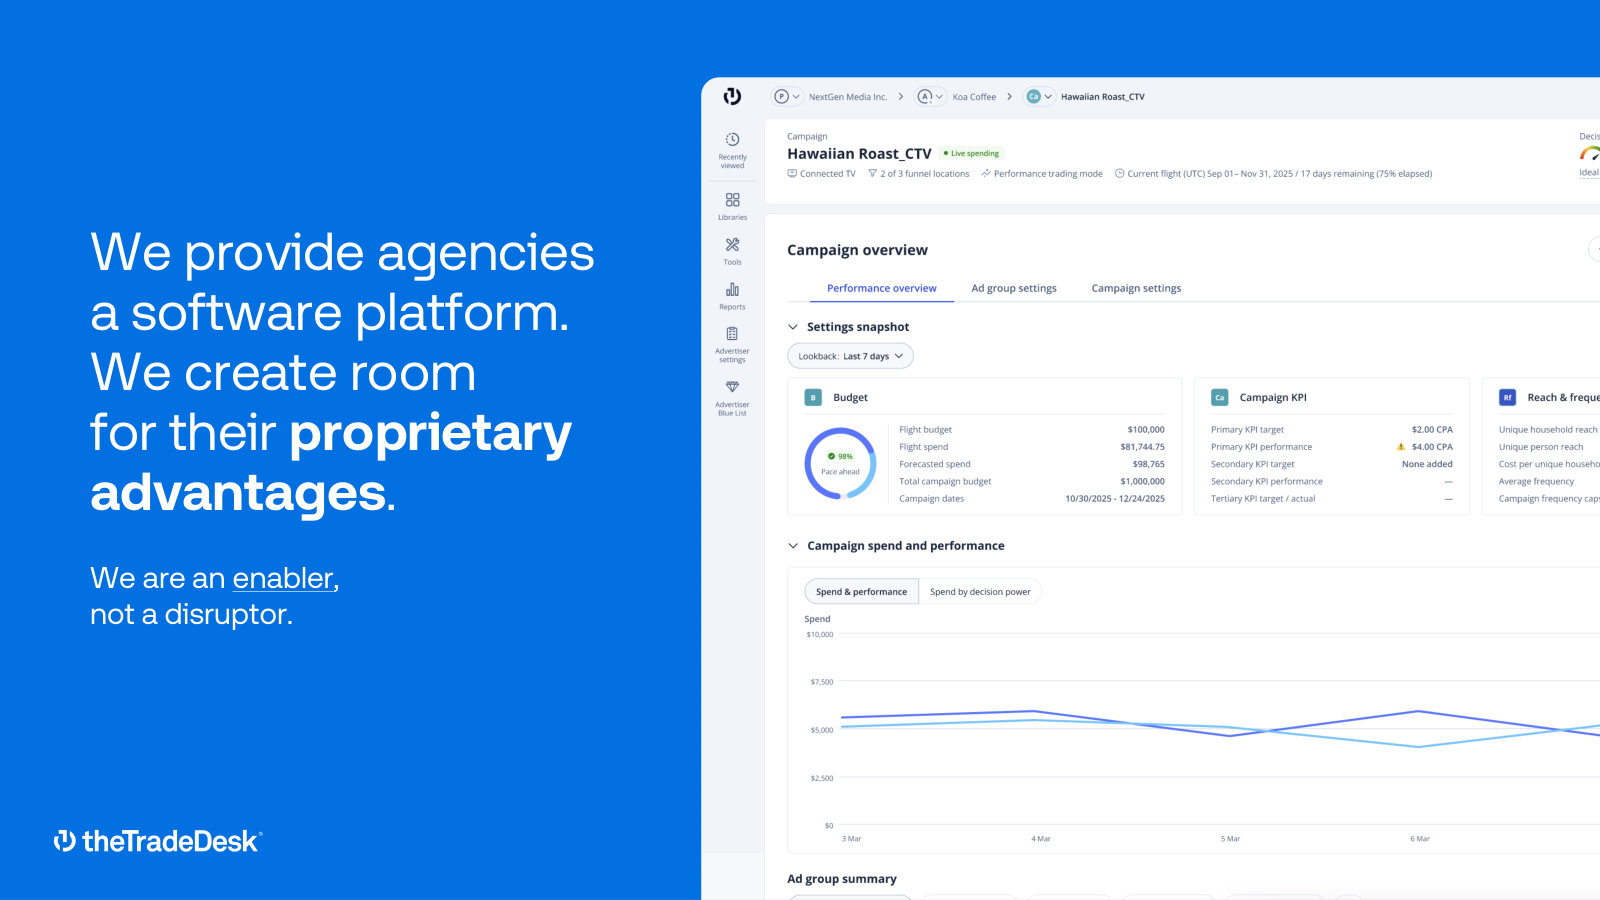
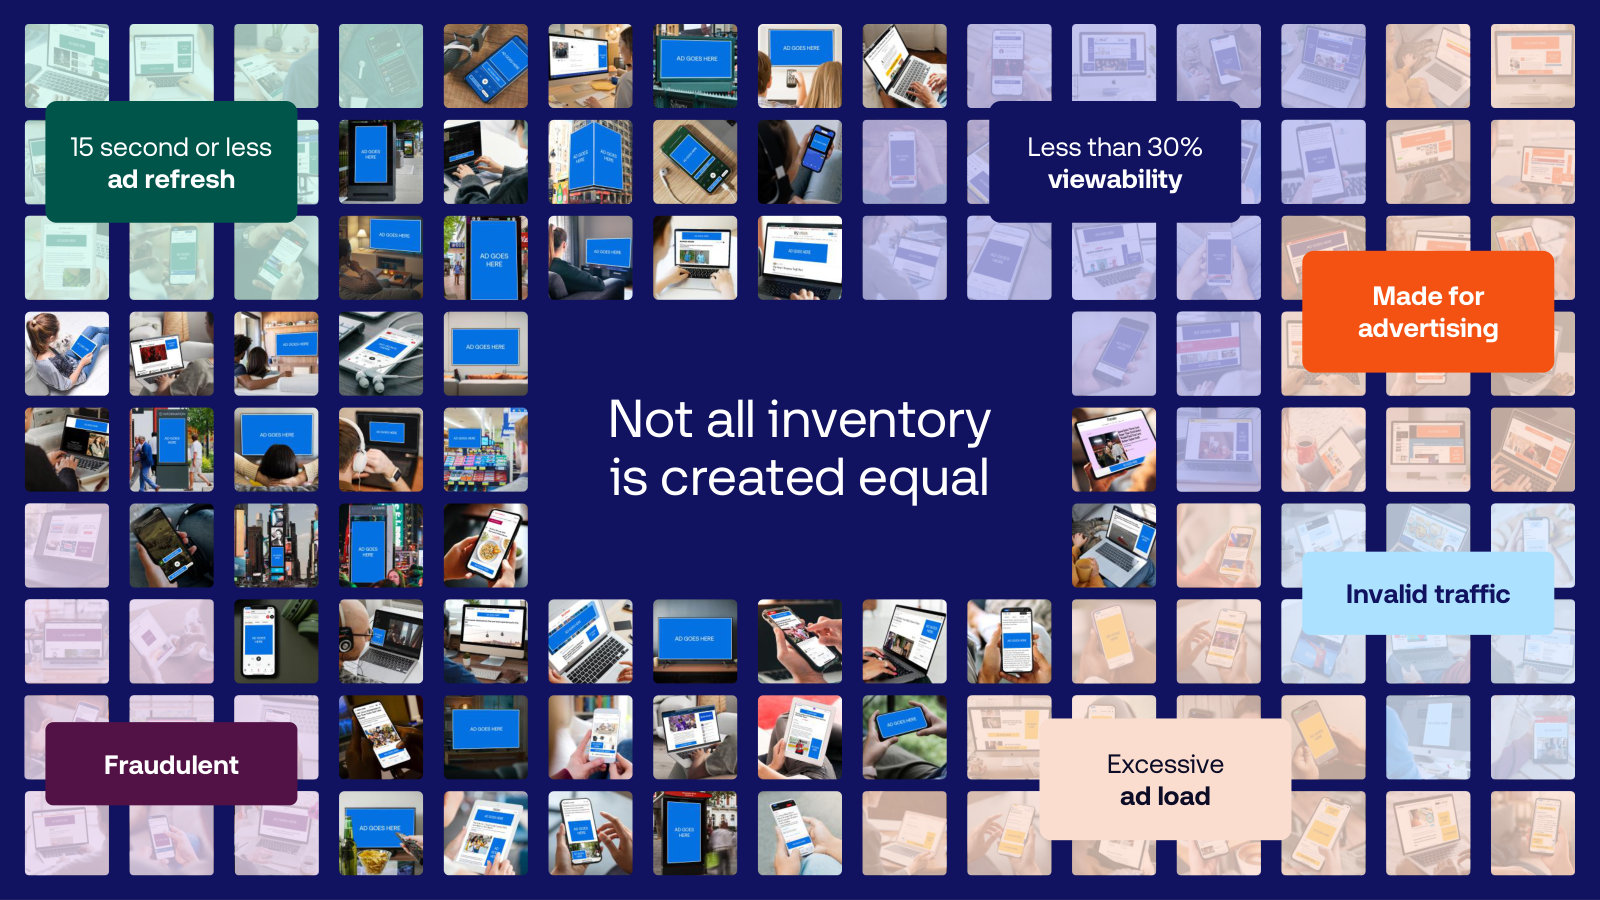
Investor Relations Presentation — Q1 2026
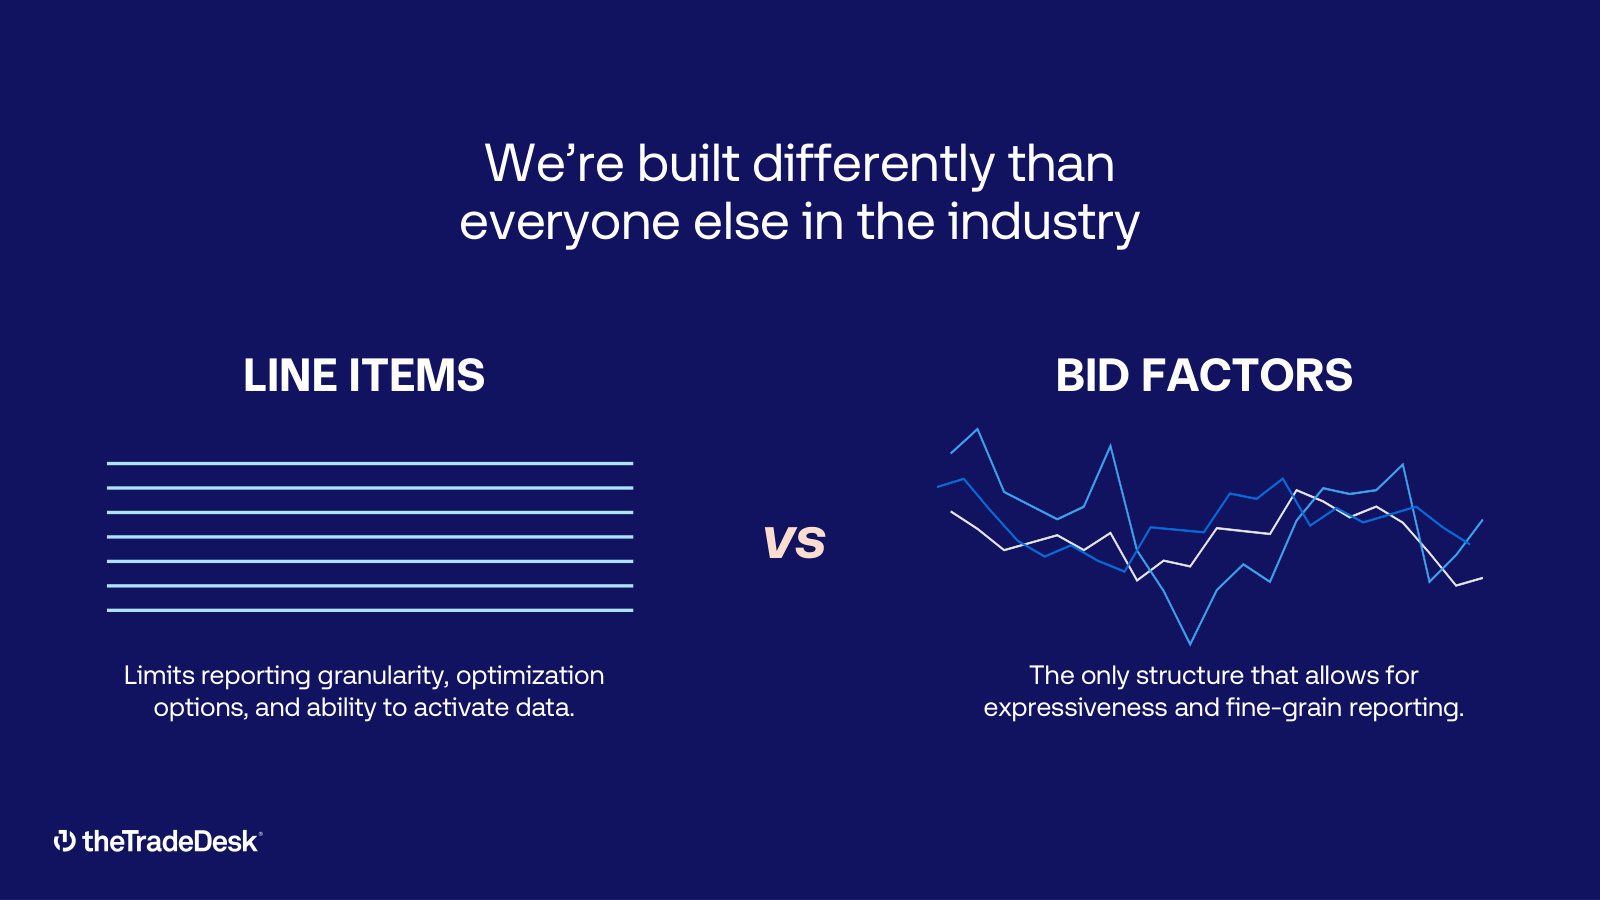
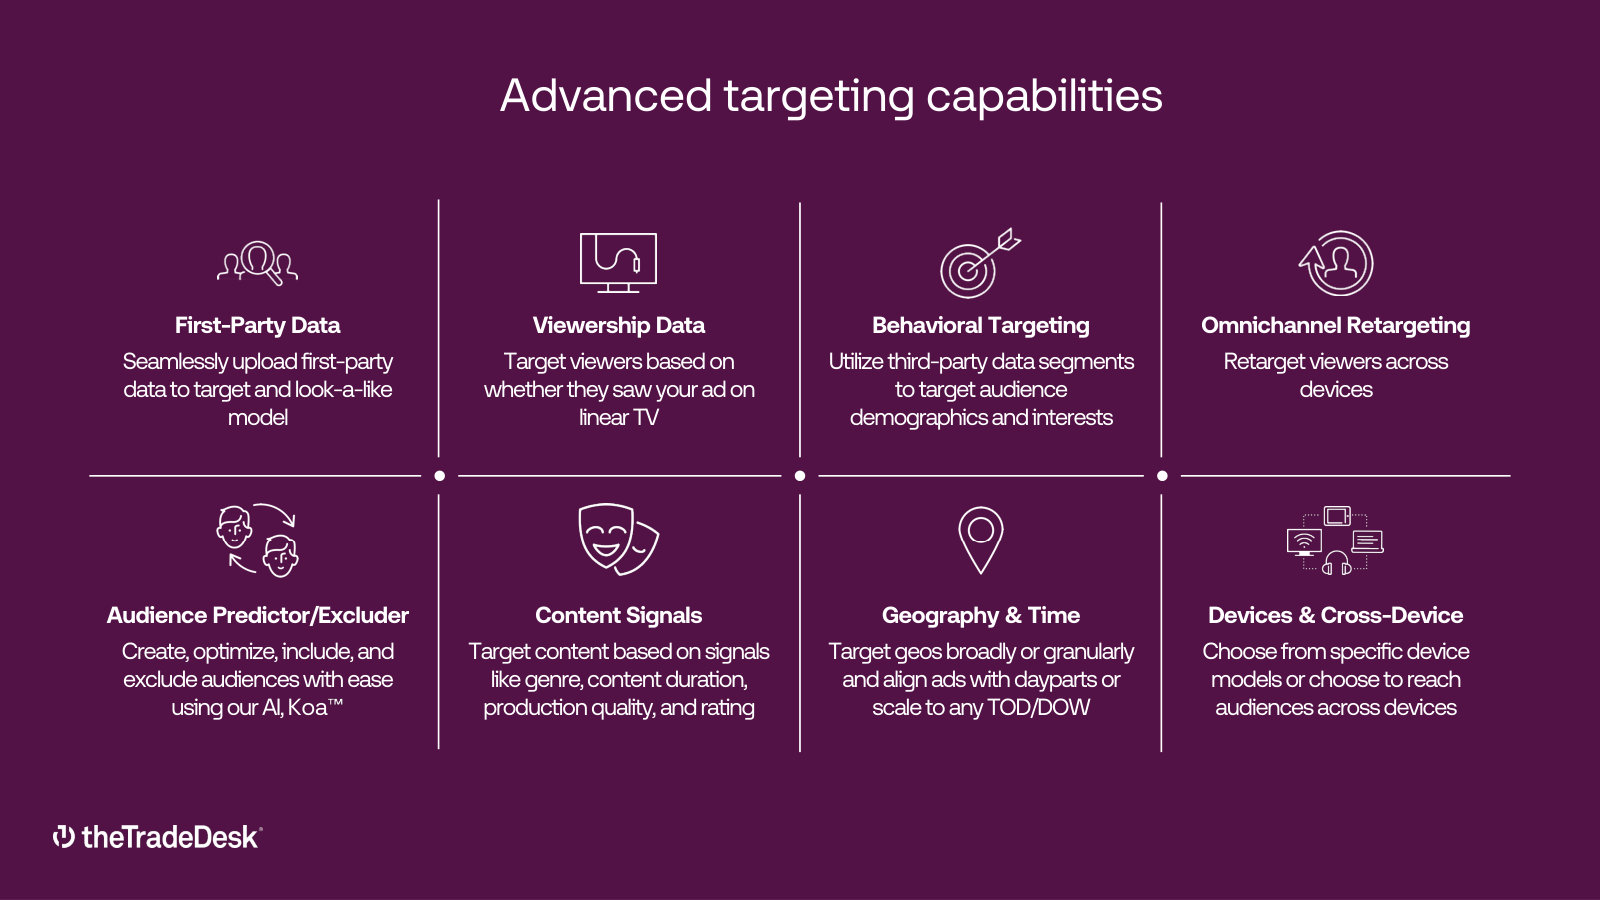
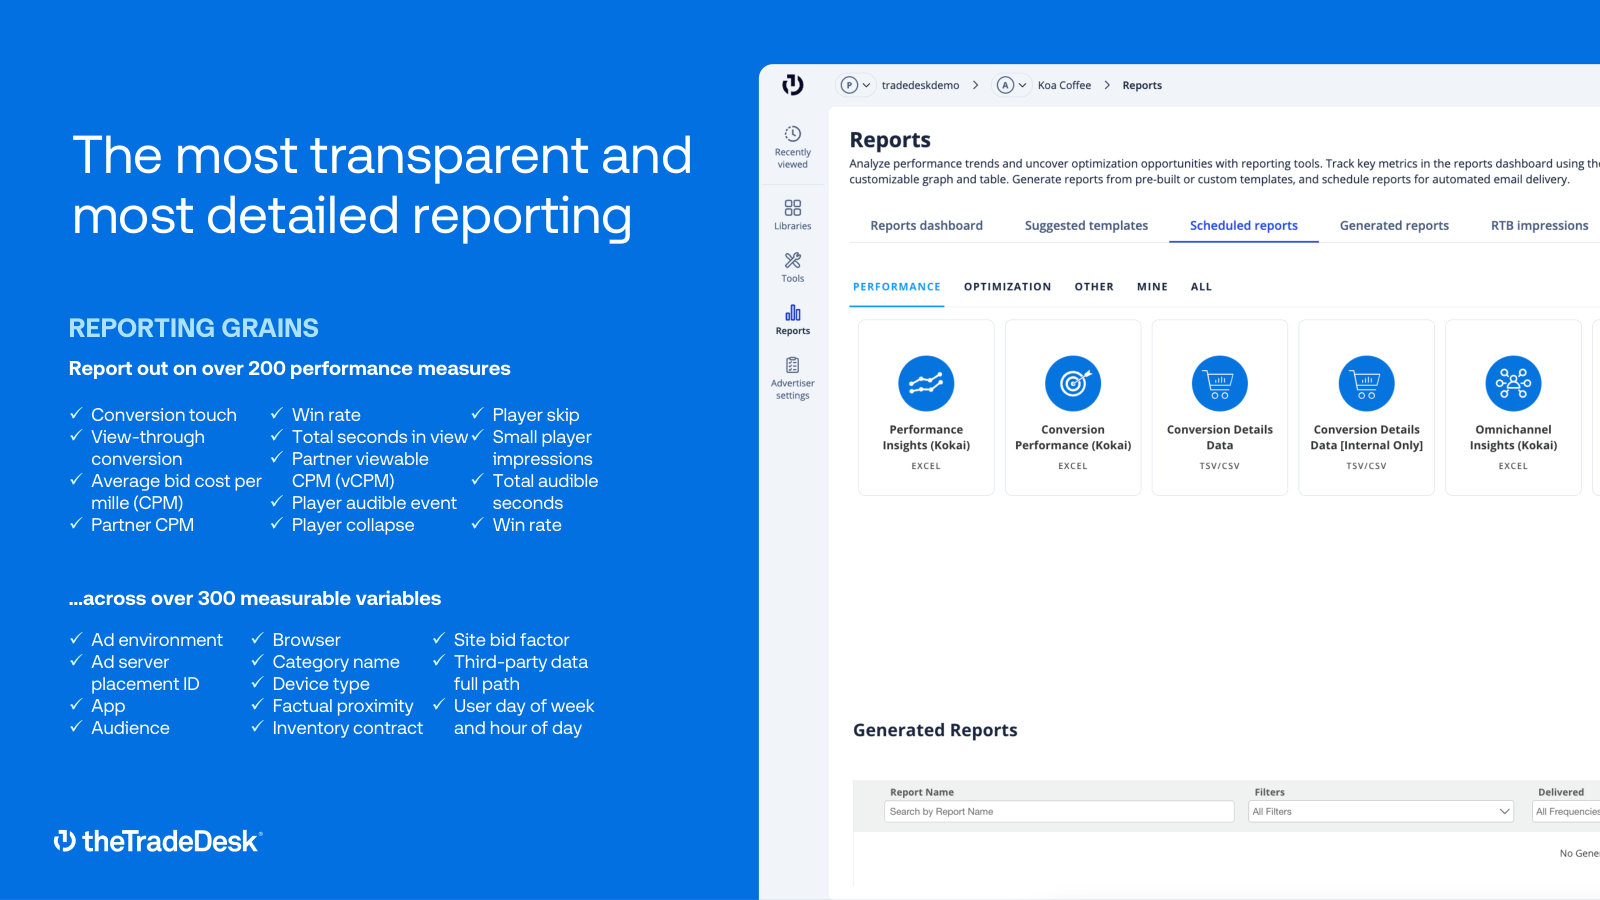
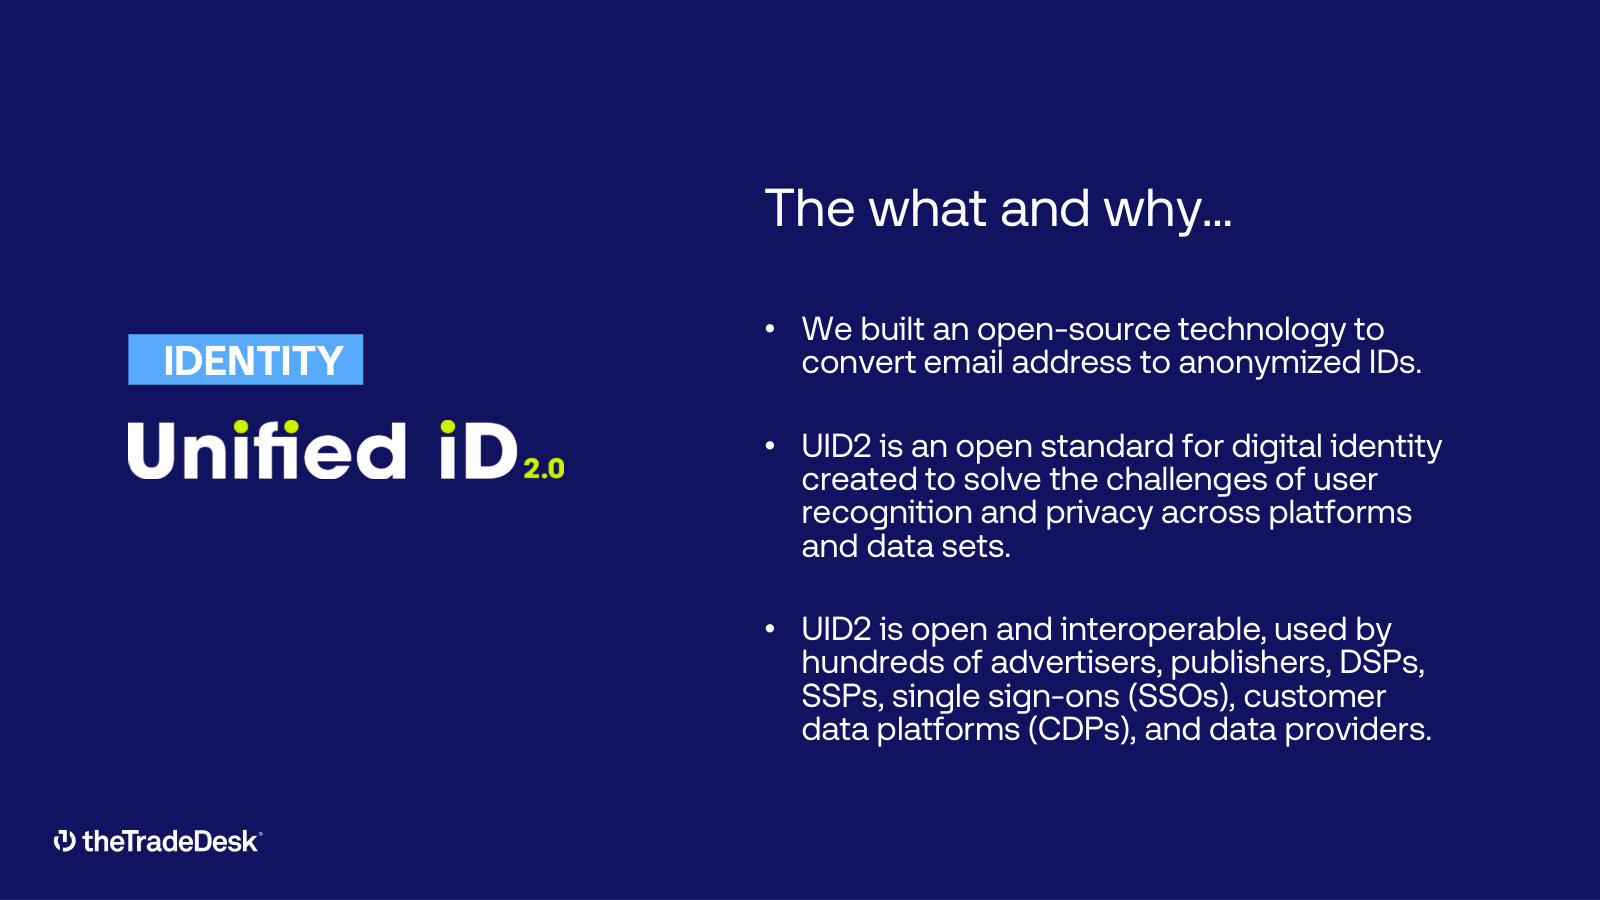
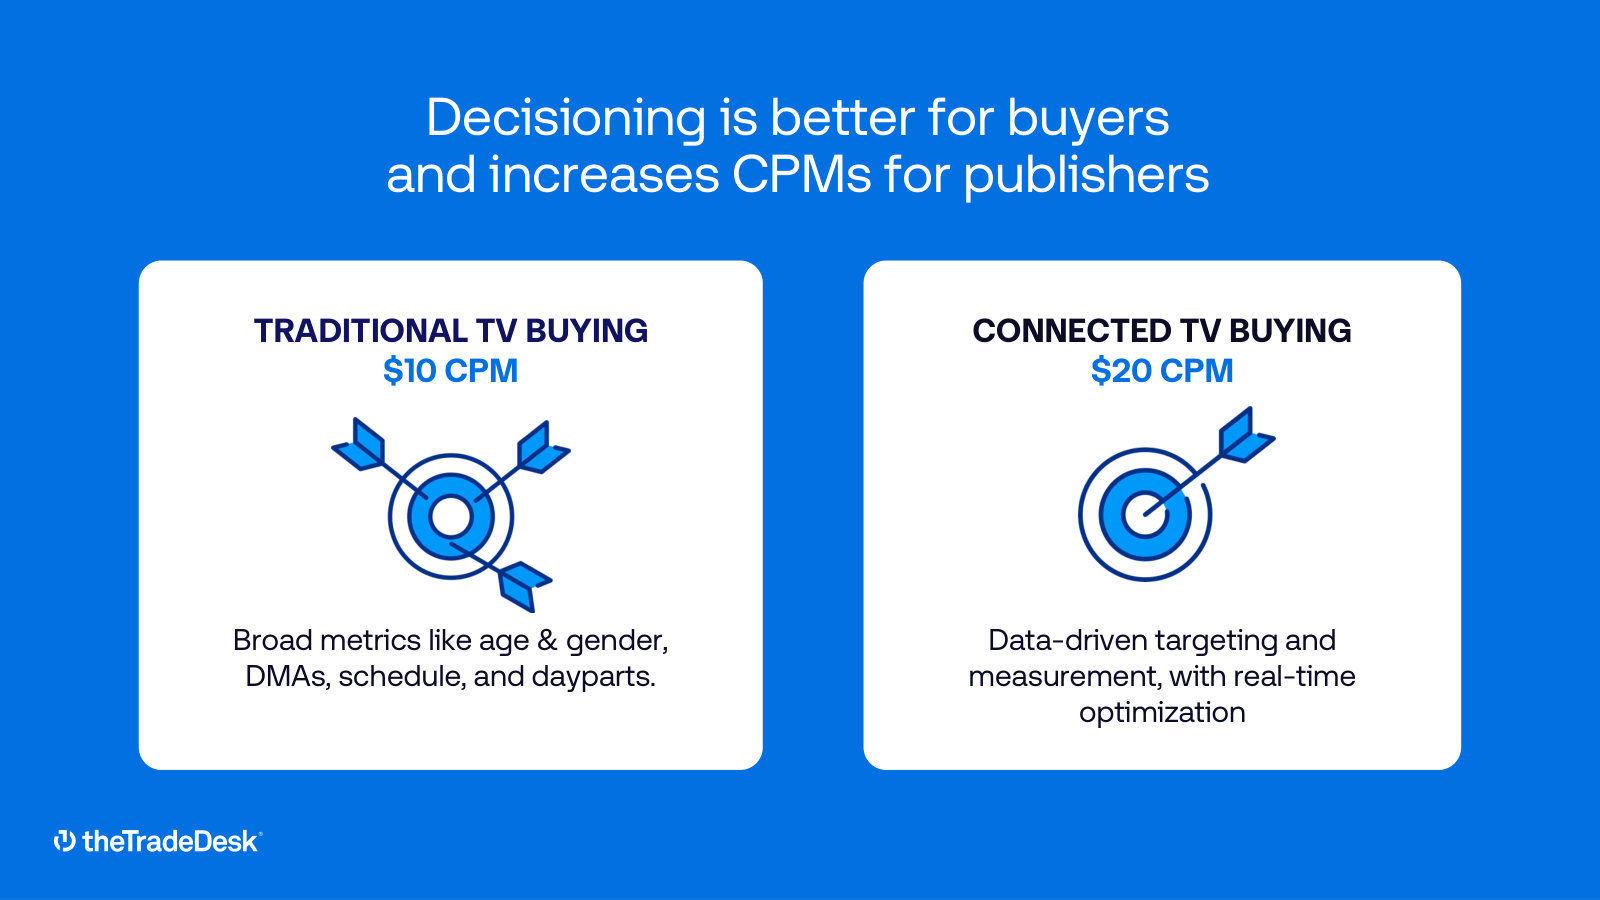
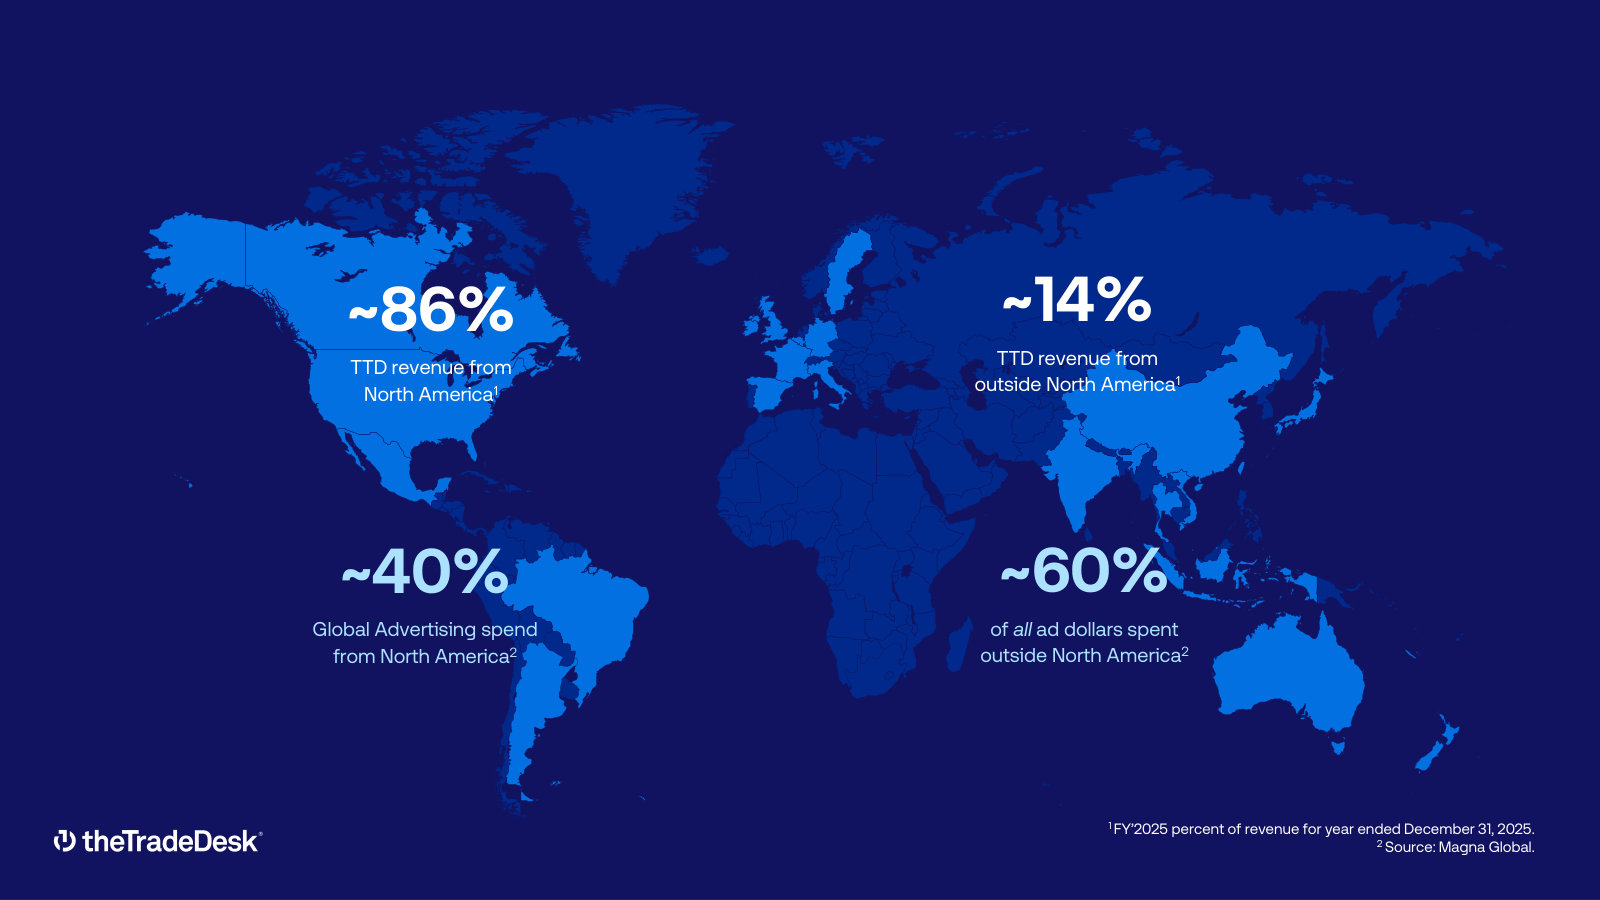
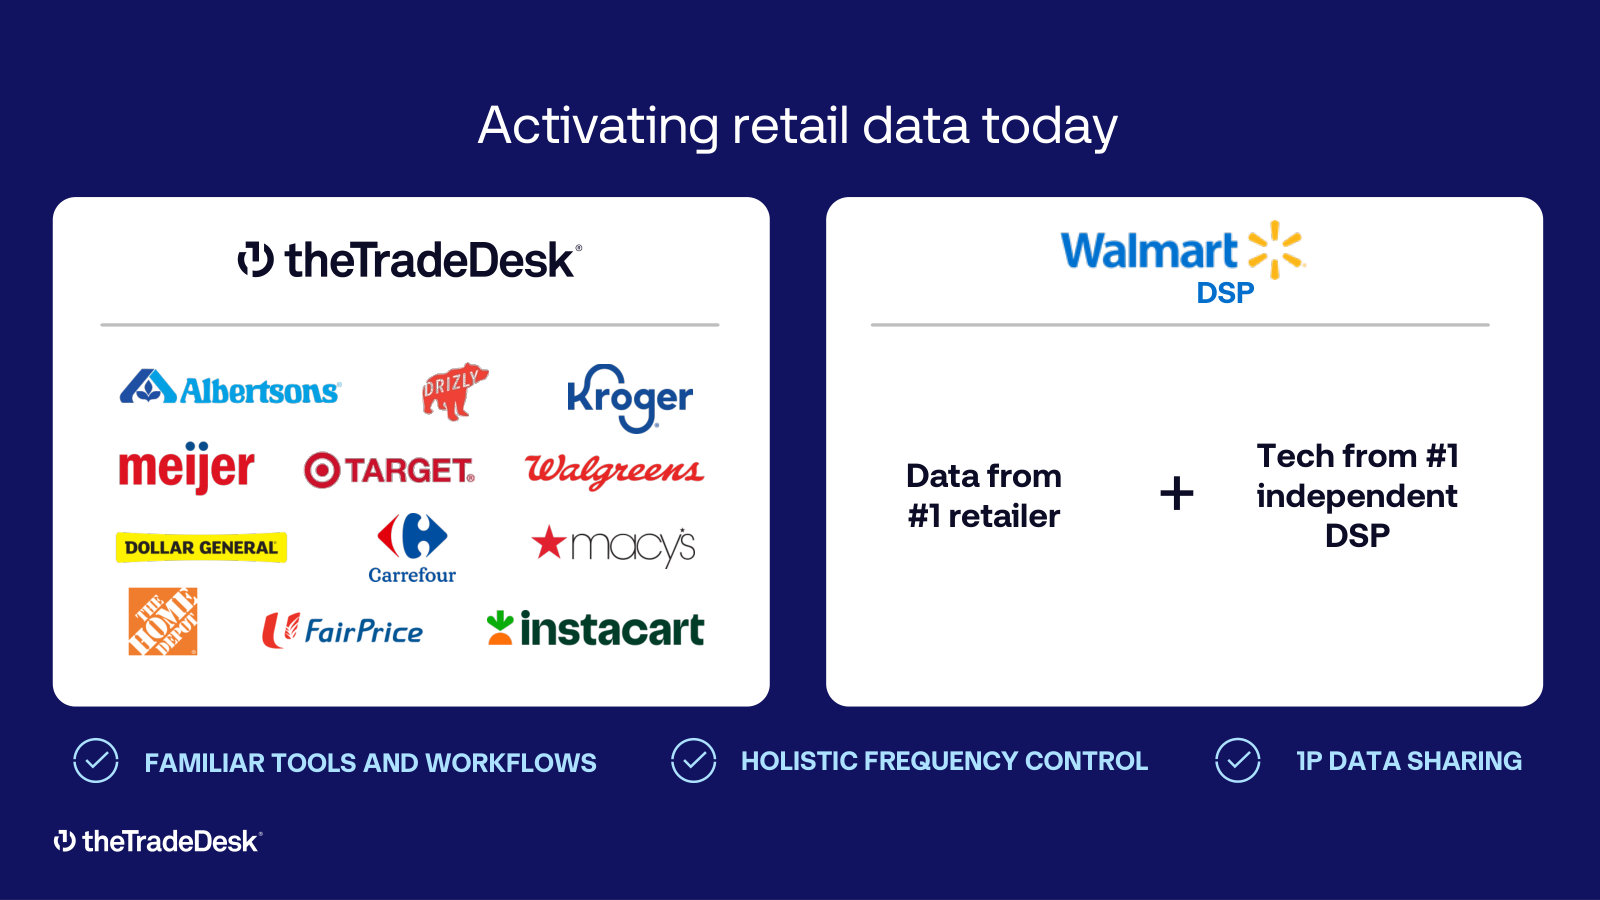
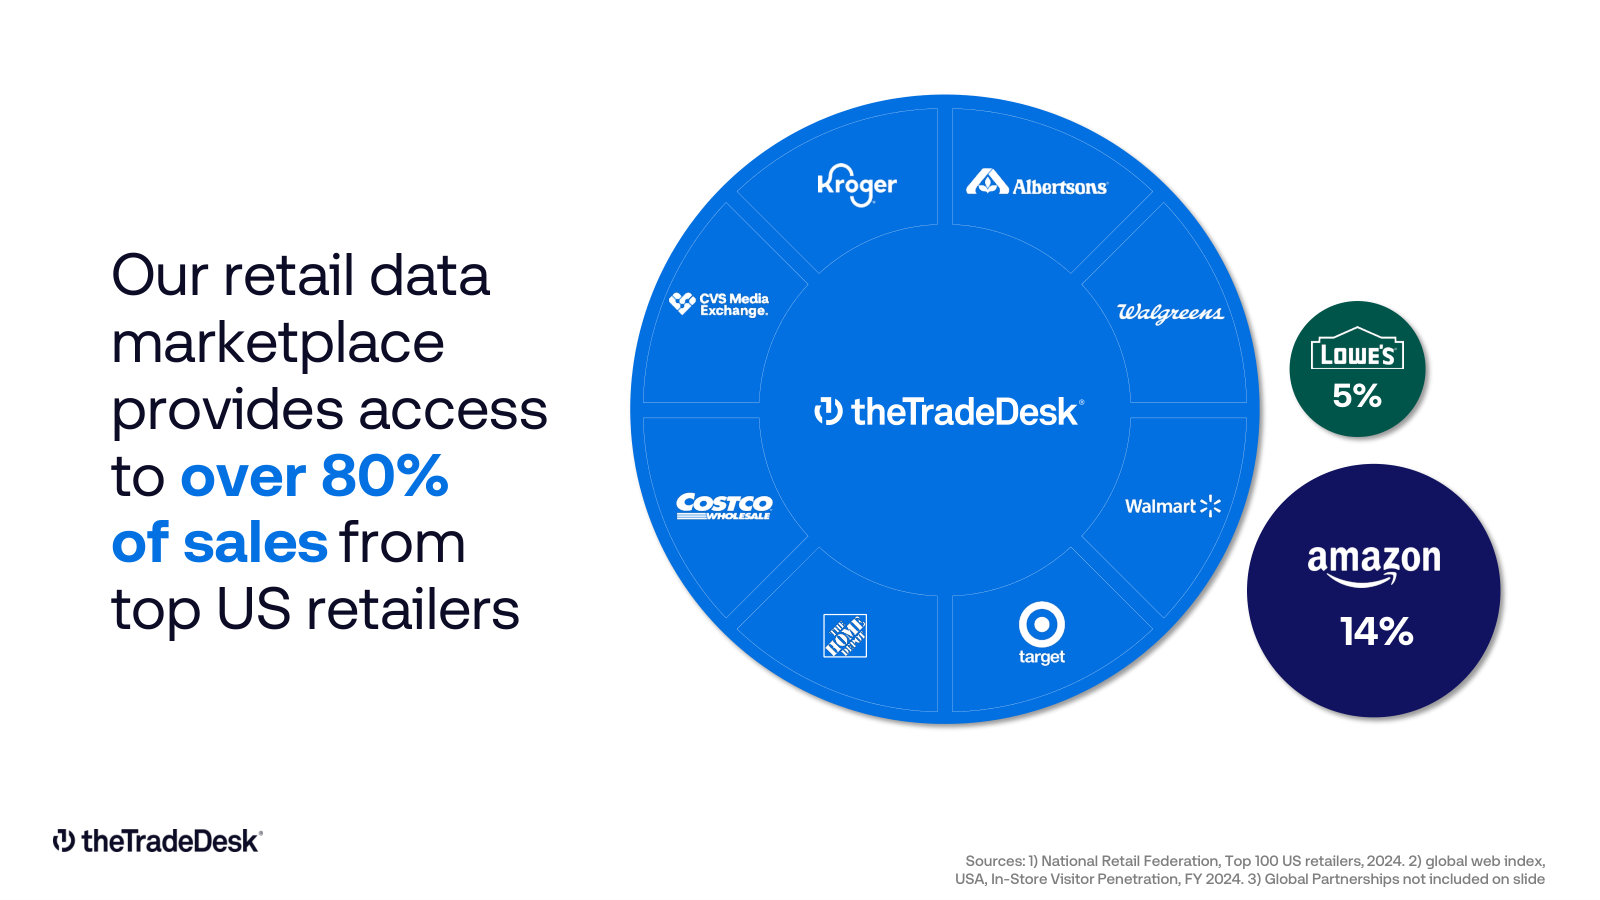
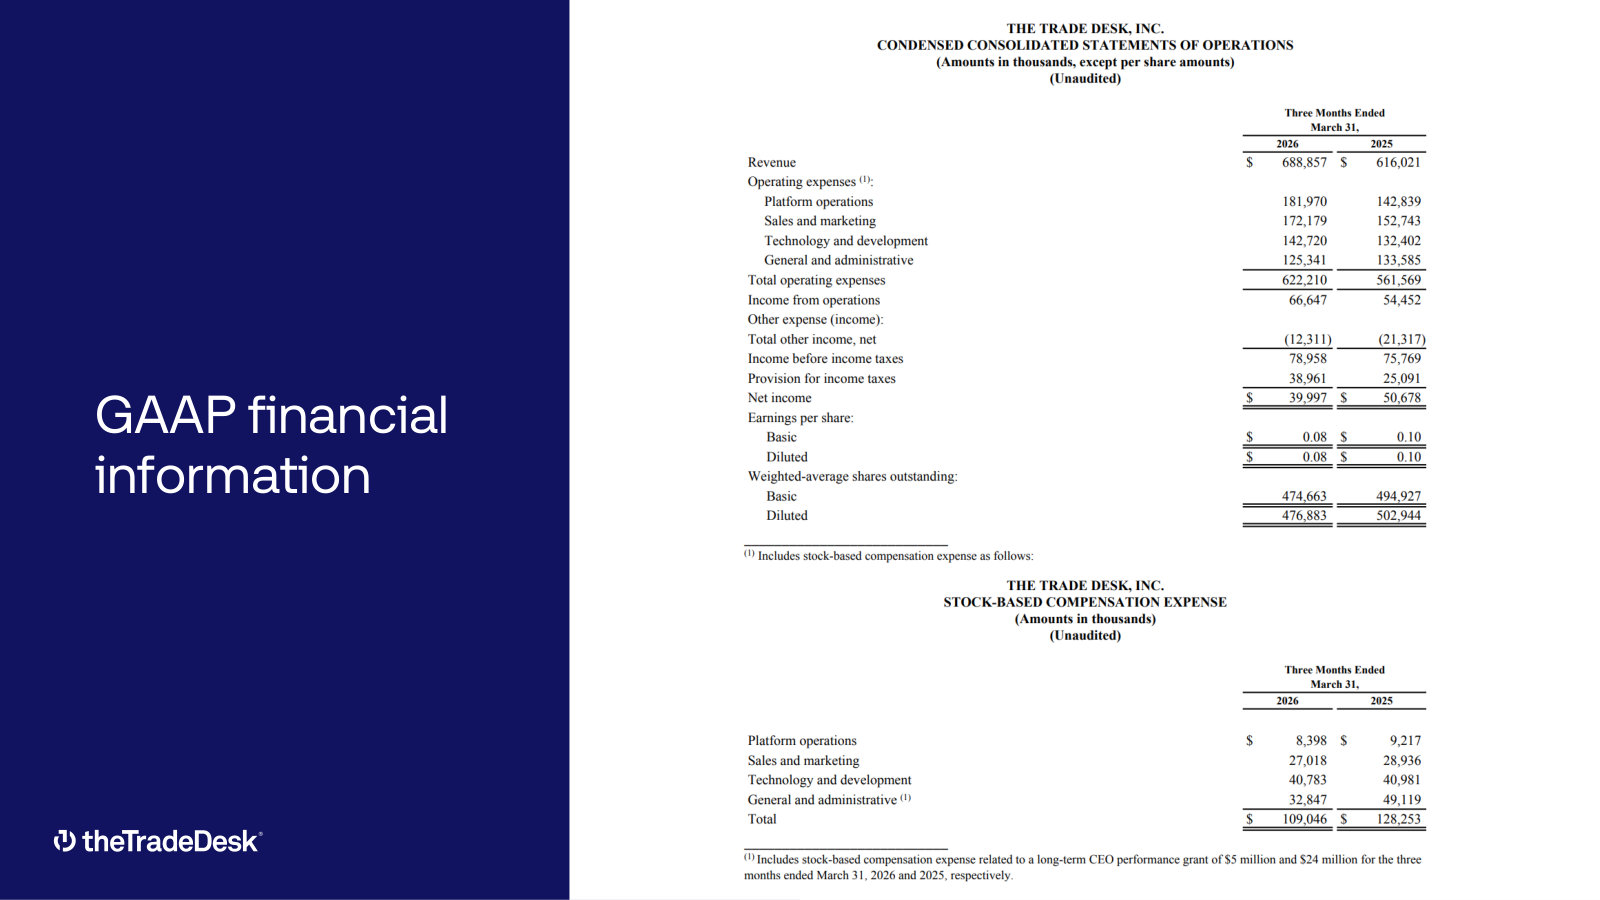
The current overview deck: what the platform does, the market it sits in, and the four growth drivers management is betting on. · Open the full document →

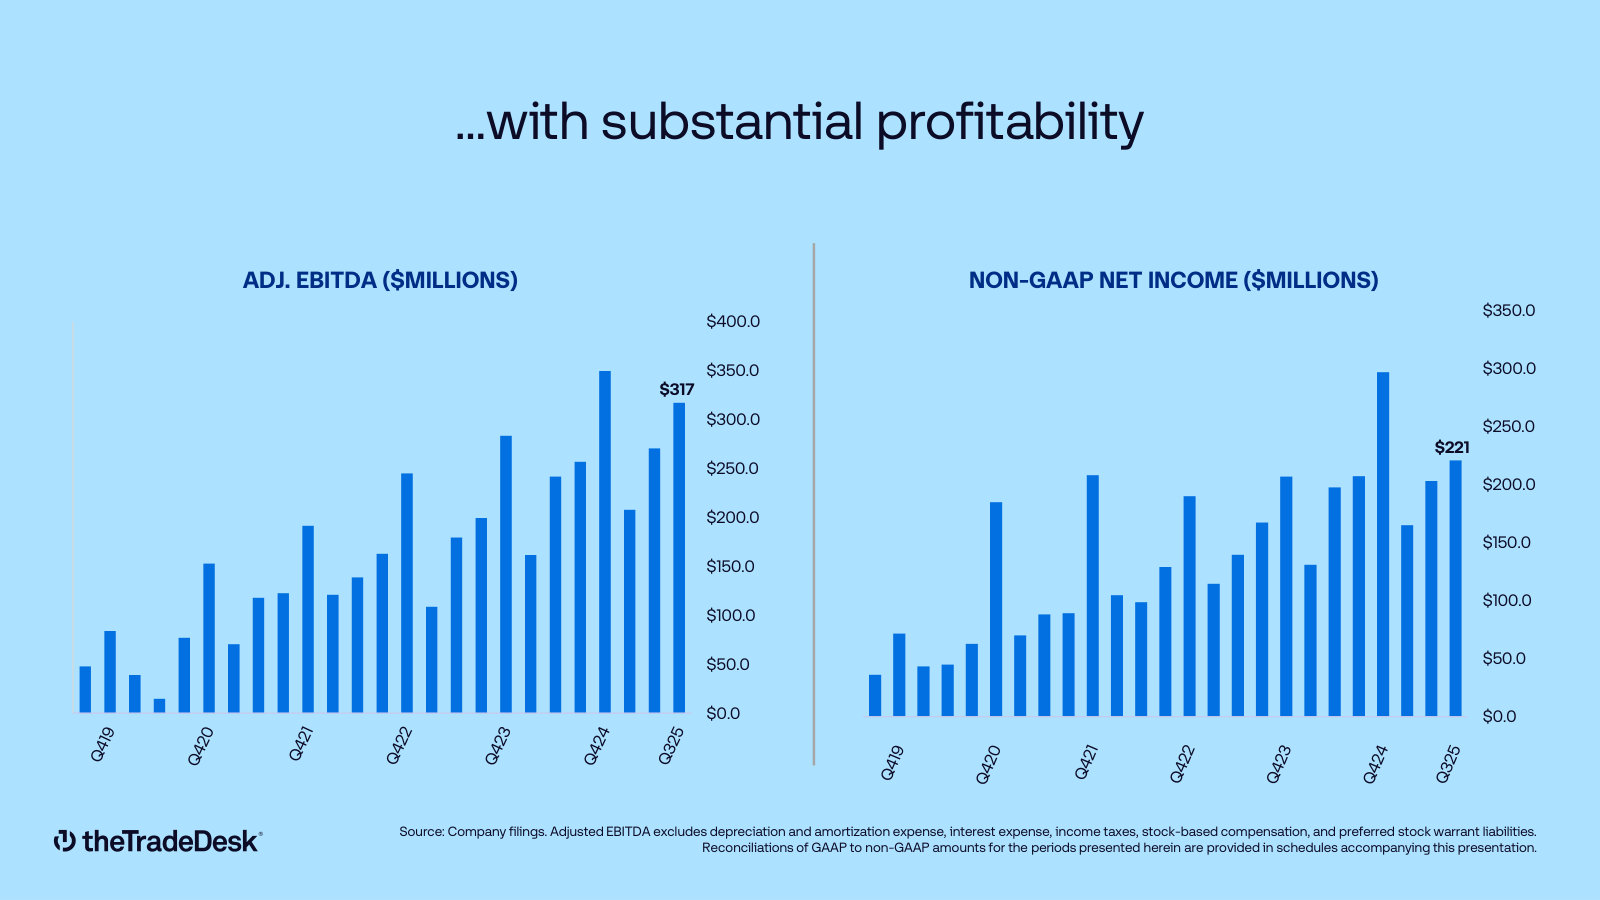
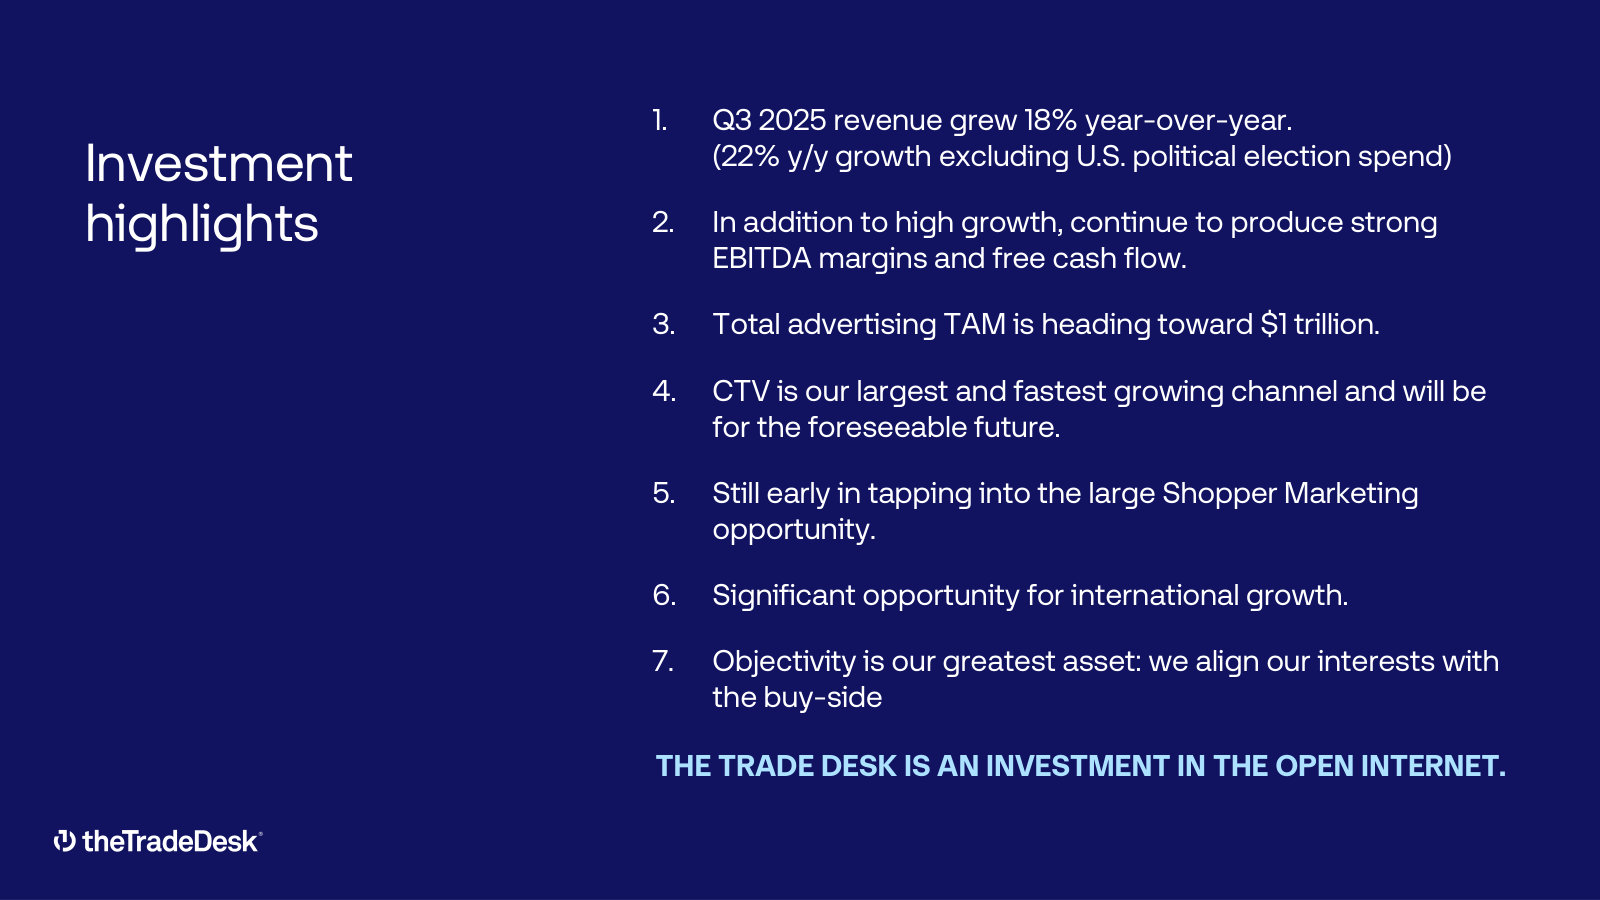
Investor Relations Presentation — Q3 2025
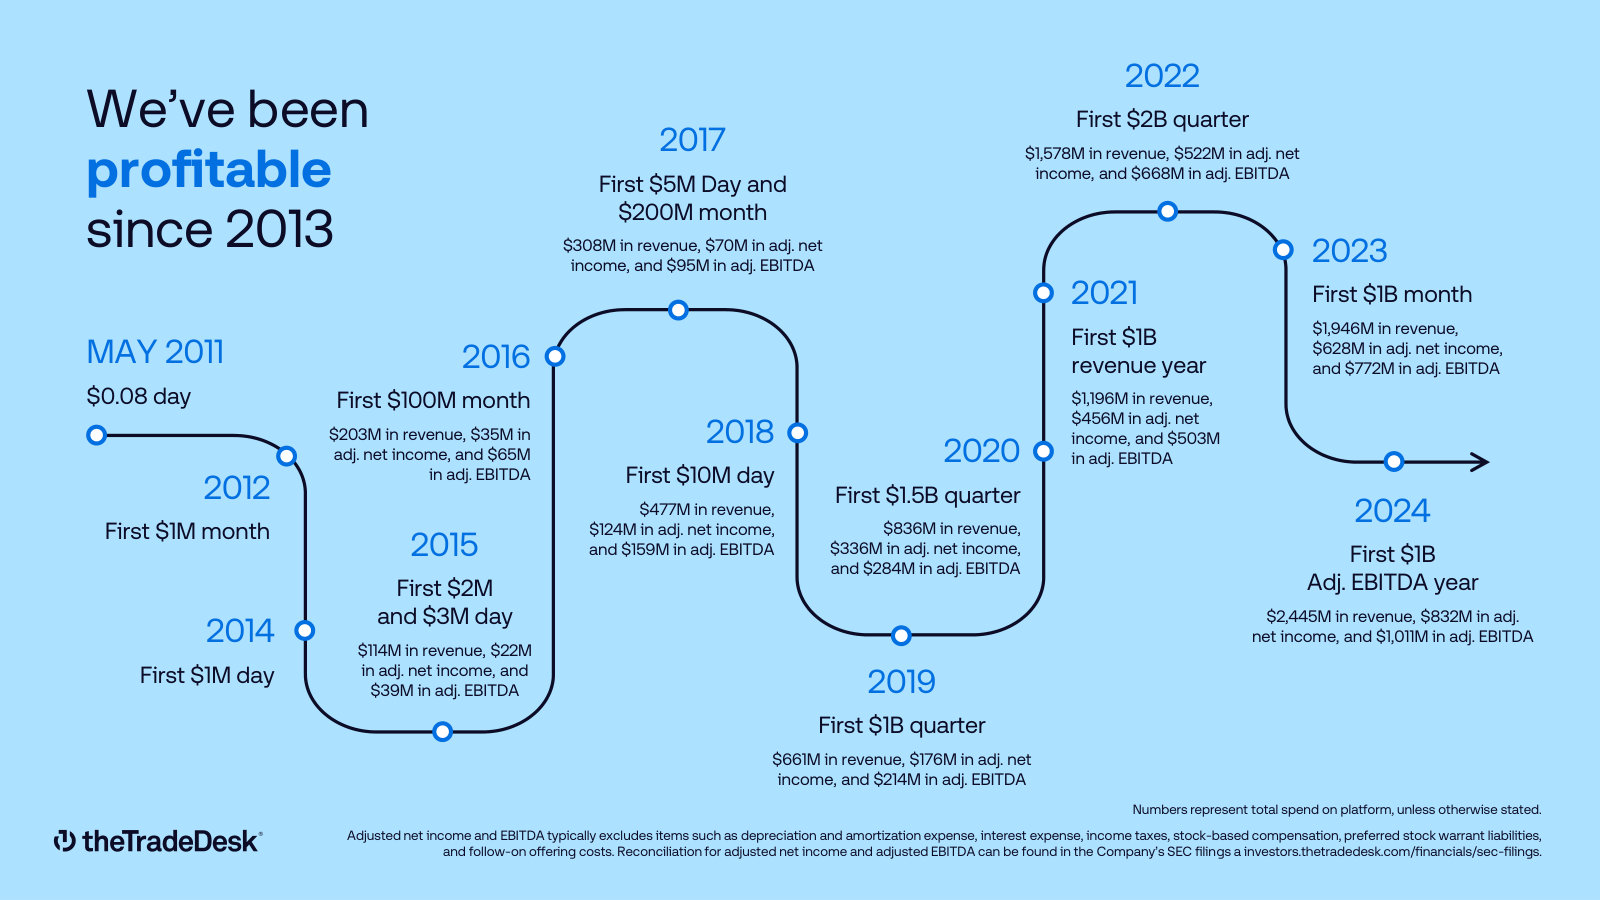
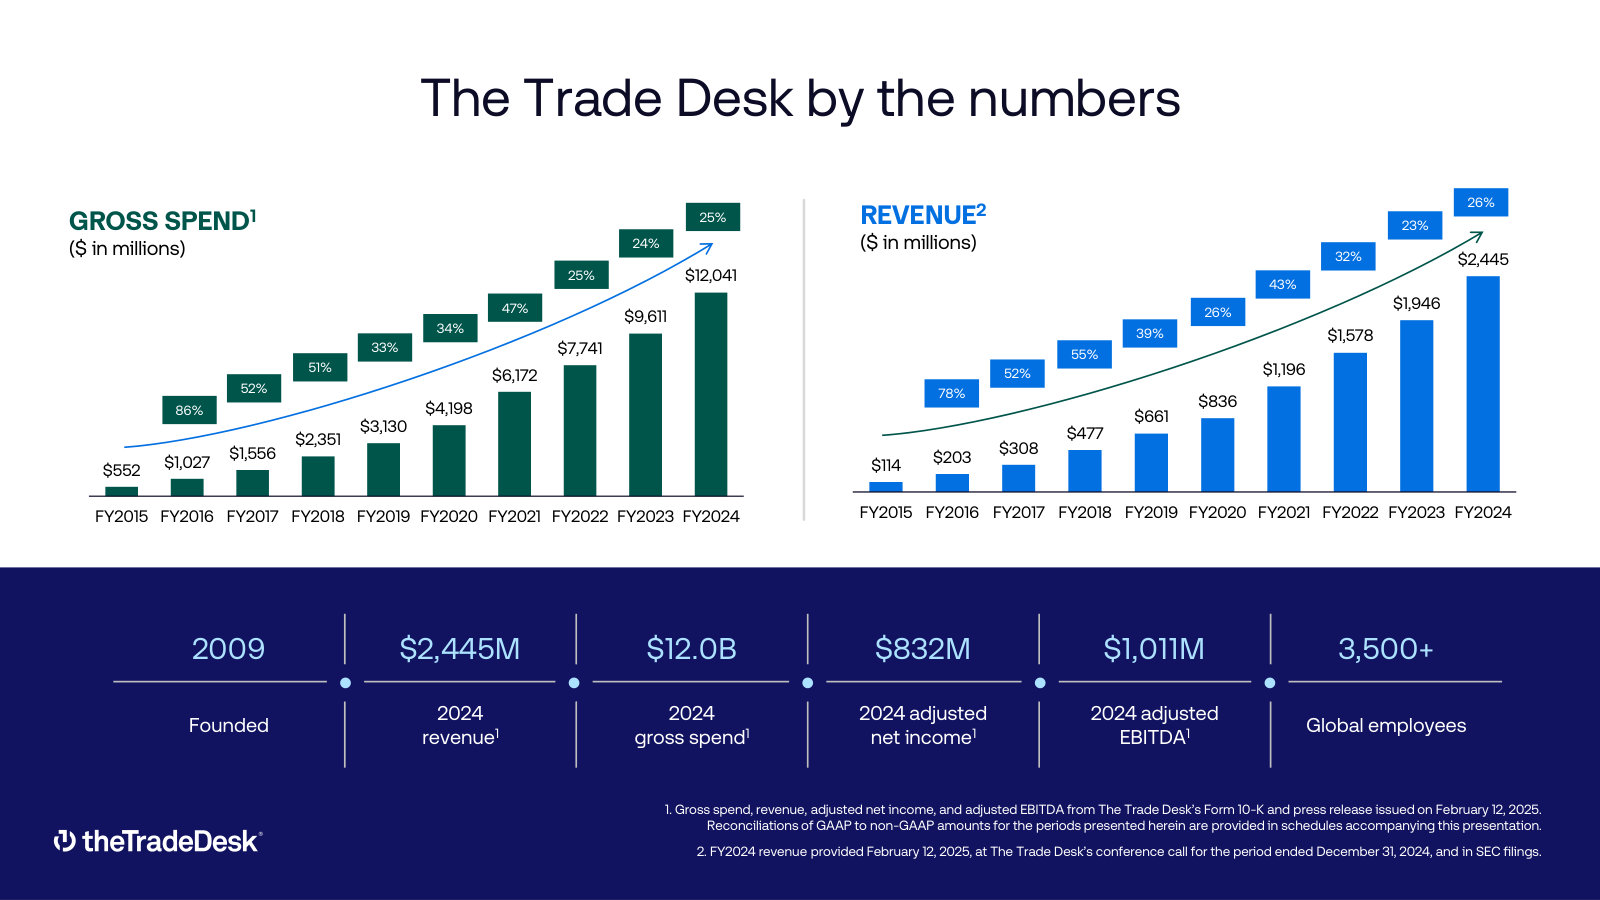
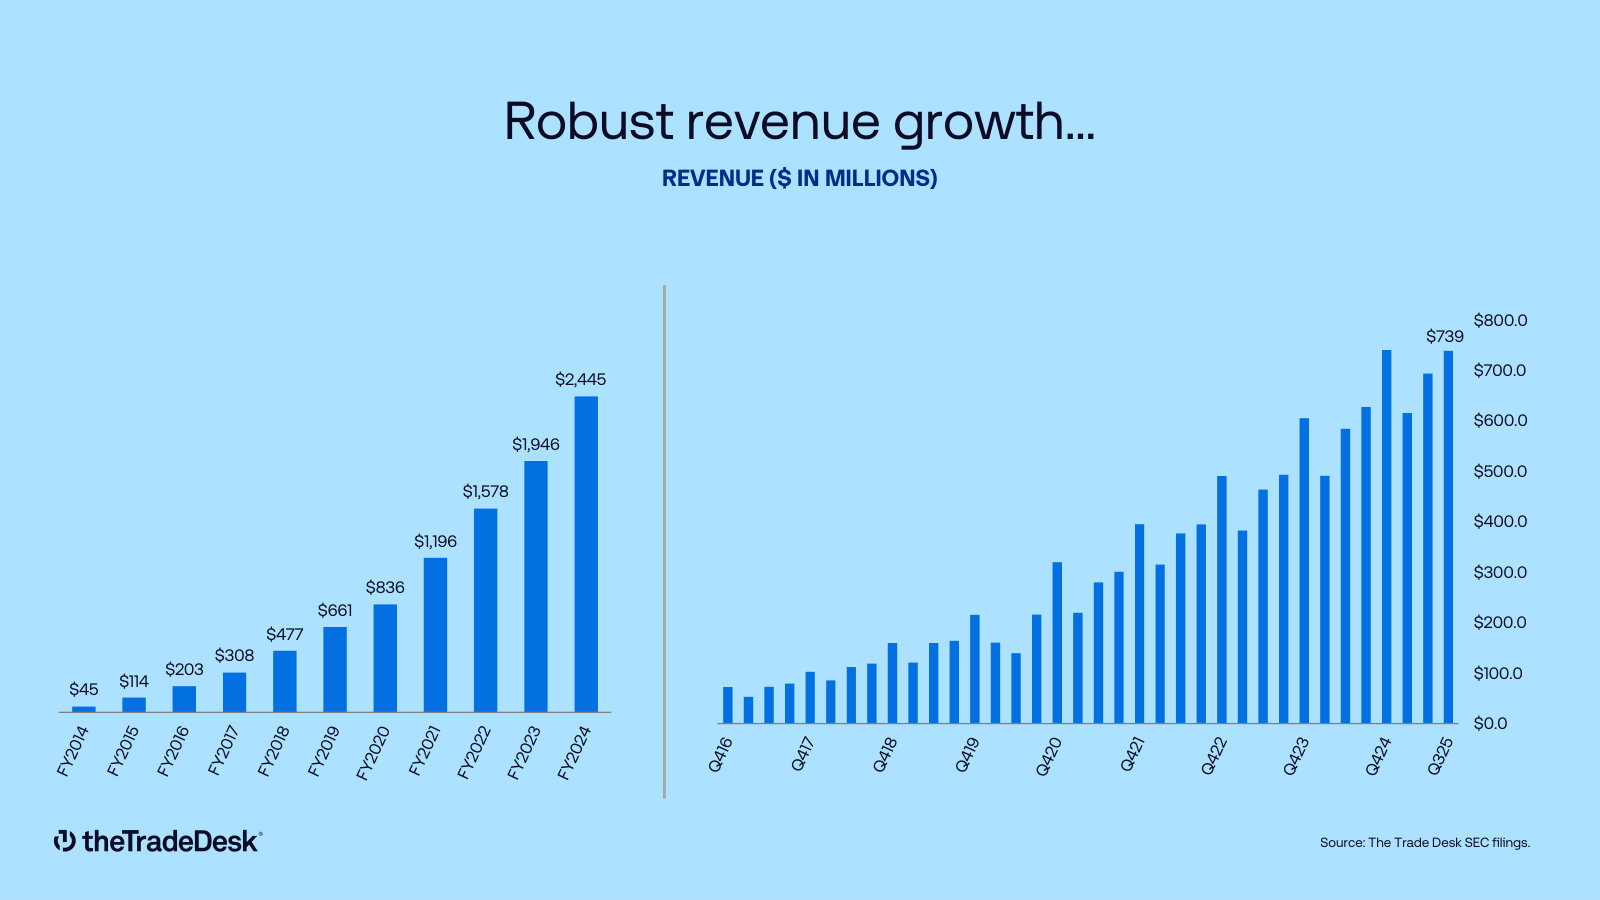
The last edition before the 2026 redesign; it still carries gross spend, bid-factor mechanics and the quarterly financial series. · Open the full document →

More from management
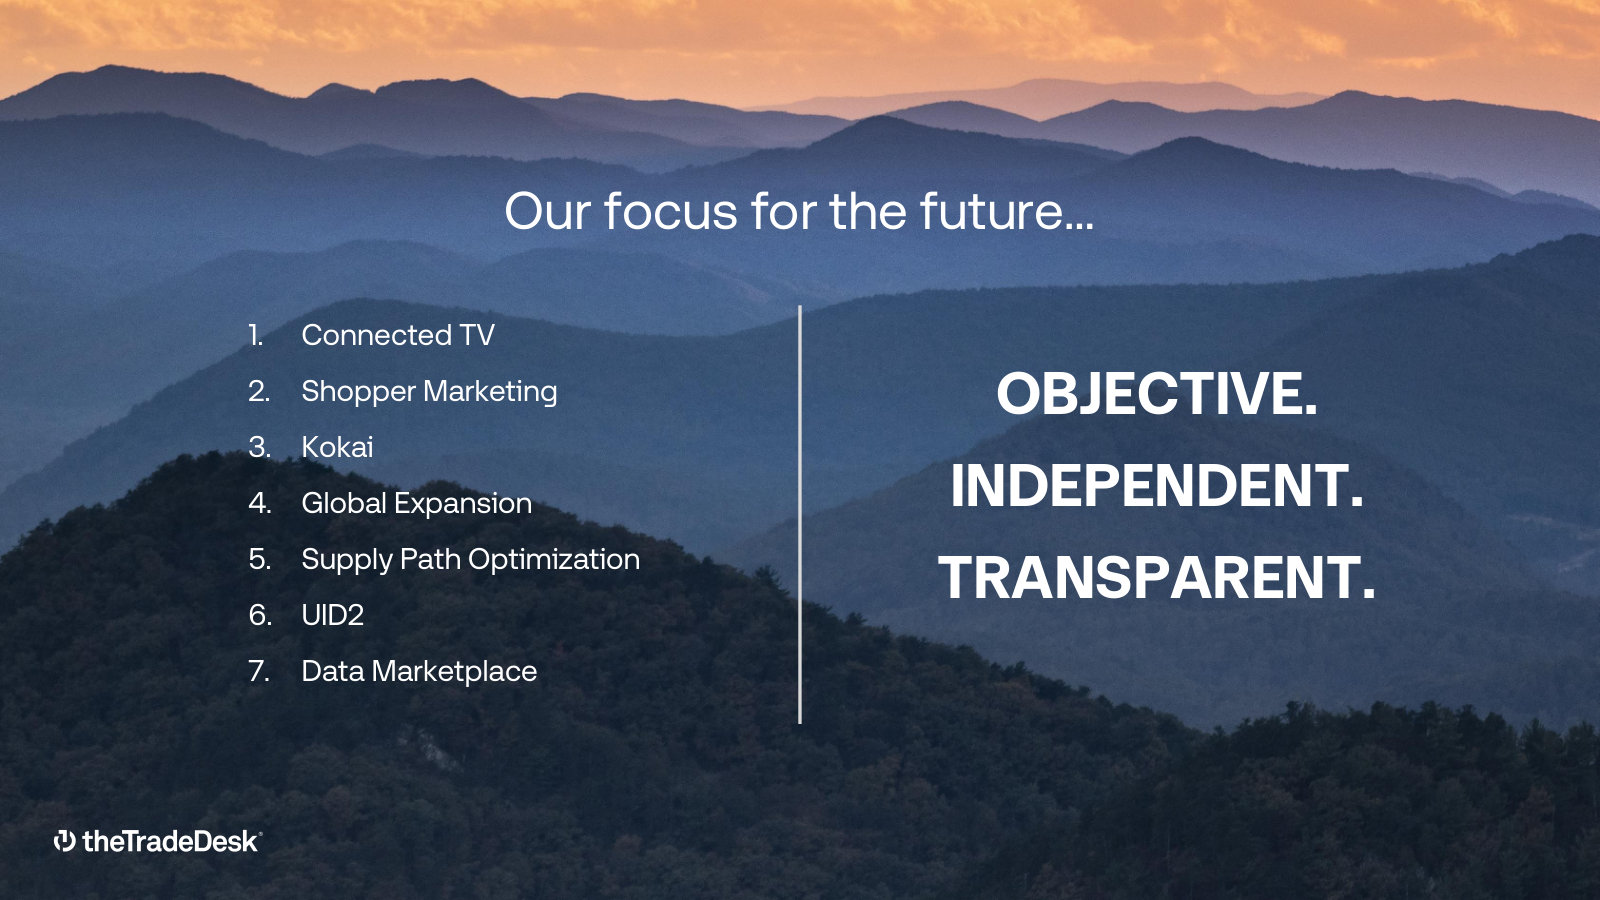
Investor Relations Presentation — FY2025 · 48 pages · FY2025 full-year edition and first outing of the redesigned deck; keeps the seven-point 'focus for the future' list the May version dropped. · Open →
Investor Presentation — FY2023 · 51 pages · The FY2023 pitch, including the TAM build-up slide later editions cut — useful for seeing which arguments management has retired. · Open →
Investor Presentation — Q2 2023 · 52 pages · Earliest deck in the corpus; the pre-Kokai, pre-shopper-marketing baseline against which the current story can be compared. · Open →
The Trade Desk, Inc.'s management answers for the business every quarter. These are the exchanges that explain it best — verbatim, from the call transcripts preserved in Sources. Each link opens the full transcript at that page in a new tab.
Q1 2026 Earnings Call — Q1 FY2026
The current state of the story in management's own words: a decelerating guide, the Publicis dispute, and where growth is supposed to come from. · Open the full transcript →
Why a record year of new ad supply is the core of the bull case, and why publishers copying the walled-garden model hit a ceiling.
Jeffrey Terry Green (CEO and Co-Founder): In 2025, the advertising ecosystem globally added more supply than perhaps any year previously. It is probably the most lopsided market in advertising history, with multiples more supply than demand. This supply-demand imbalance creates the biggest buyers market in the history of advertising. Buyers have the option to be selective, but they need to leverage data and great real-time technology to know what they are buying. Premium advertisers and premium publishers often have been at odds for most of the internet’s history. But at this moment, both are heavily invested in making the supply chains and market dynamics of the premium open internet successful. In this buyers’ market, some publishers are mistakenly copying the Facebook and YouTube walled garden business model. For most of them, it has a couple of years, and then it hits a scale ceiling. The walled garden strategy only works when a publisher is massive, and a must-have on a media plan. […] Most marketers now have a clear definition of the open internet that includes media beyond the browser. The best of movies, TV, sports and all live events, journalism, and music are all the anchor tenants of the open internet. As a result of this dynamic, the open internet is thriving and evolving very fast. We are convinced that the evolution and changes being made in the open internet today will make it soon become a place where, consistently, an advertiser’s first dollar is spent, not the walled garden leftovers.
p. 2 · Read in context →
The commercial engine in numbers: JBP signings, and a named win-back from Amazon that shows what the pitch actually is.
Jeffrey Terry Green (CEO and Co-Founder): We are seeing these behaviors translate directly into business. March was our biggest month on record for JBP signings. We signed 45 JBPs in March alone. For Q1, our total JBP count grew 55% year over year. And excluding renewals, new JBP deal spend grew 40% year over year during the quarter. To highlight one of these deals, our pharma team recently went head-to-head against Amazon for one of the largest pharmaceutical advertisers in the world. Lured by seemingly low rates, this brand shifted some investment to PG on Amazon last year. Over the past nine months, our team delivered consistent partnership and focused on driving real business outcomes for the client. In Q1, our team won back the business and signed a JBP for 2026 that will increase their spend on our platform by 114% year over year.
p. 4 · Read in context →
The retail-data asset sized against Amazon, and the first hard numbers on the new flat-fee data product.
Jeffrey Terry Green (CEO and Co-Founder): Over the last five years or so, we have created the world’s largest and richest marketplace of retail data. Combined, we believe the retailers in our data marketplace represent more than 80% of sales from top U.S. retailers, compared to Amazon, who represents less than 15% of U.S. retail spend. This is a huge advantage for us. For example, a leading travel brand recently ran a test to evaluate campaign performance with and without activating our new product Audience Unlimited. The results across all KPIs were fantastic. Audience Unlimited delivered 30% lower CPMs on media, 38% lower data costs, a 75% more efficient CPA, and a 2.7x increase in conversion rate compared to the control group. Most importantly, Audience Unlimited increased campaign performance while simultaneously reducing manual effort in the audience selection process.
p. 5 · Read in context →
The two questions that opened the call: the Publicis dispute, which he declines to detail, and the implied Q2 slowdown.
Shyam Vasant Patil (Susquehanna); Jeffrey Terry Green (CEO and Co-Founder): Hey, guys. Good afternoon. Jeff, I had a couple of questions. First one, can you provide some comments on the Publicis discussions? And then second, can you talk about the factors that you see driving the deceleration in your Q2 outlook? Thank you. […] But I will say that since 2018, we have done billions of dollars of business with Publicis through the agreement that we have. And we continue to have great dialogue with Publicis about the next chapter of our partnership. Our negotiations are ongoing. It is probably not prudent for me to say more about it in this forum, so I will just leave it at that on Publicis. […] As to the specifics, some of the fast-growing verticals we believe would be growing even faster if they were absent the current macro uncertainty, where there is geopolitical instability, there are tariffs, there are broader consumer pressures that are impacting growth. But what gives me confidence, really, is that nearly every major brand we speak with is focused on the right question right now, which is how do we get back to growth as a brand?
p. 7 · Read in context →
How a 40% full-year margin is defended off a 30% Q1: headcount below revenue growth, and pacing flexibility rather than named cuts.
Justin Tyler Patterson (KeyBanc); Tahnil Davis (Interim CFO and CAO); Jeffrey Terry Green (CEO and Co-Founder): Great. Thanks. Good afternoon. I am curious to hear more about investment priorities against that 40% EBITDA margin target. Obviously, revenue and margins are both off to a softer start in the first half. I am curious how we should think about the levers to achieve that target. Thank you. […] As a company, we have always been very disciplined around hiring and reinvestment in the business. 2026 is a year of disciplined reinvestment for us. We expect our full-year adjusted EBITDA margin percentage to be at least 40%, approximately in line with last year. We again expect headcount growth to remain below revenue growth, reflecting continued operating discipline and increasing productivity across our business. At the same time, we will continue investing in areas where we see the highest long-term ROI, particularly around platform innovation, AI, retail media, and measurement. One advantage of our model is that we generate strong cash flow and can maintain significant flexibility in how we pace our investments and expenses, which allows us to maintain those high levels of profitability. So our focus is clear: maintain strong profitability, invest where ROI is the highest, and continue positioning the business for greater leverage over the long term. […] And I will just add that maintaining strong profitability has always been a part of our culture at The Trade Desk, Inc., even when we were a much smaller company. In fact, I was very obsessed when I founded the company with racing to profitability. It was my view that that is how we could own our future, but it is also how we could establish a culture that was extremely disciplined.
p. 9 · Read in context →
The clearest statement of why he thinks AI search reopens the search TAM that programmatic was locked out of.
Jeffrey Terry Green (CEO and Co-Founder): I think some people have wrongly assumed that their monetization will look like, "legacy search." Legacy search was born when the average search query was less than two words. No good AI prompt is two words or less. They are much more detailed. And when you have many sentences and are asking a very specific question or prompt, obviously, the answer often is much more valuable as well to the user. So it is not unreasonable to think that many of the LLMs are going to try to get as much ad monetization as possible. If you look at it as there is a subscription, which is quite expensive, and that either needs to be offset or substituted by an ad experience that is extremely profitable, that extremely profitable ad experience cannot just be keyword-based or like legacy search. In fact, in order to make the most amount of money, it might, in some cases, need to include video. If there is a lot of compute cost that goes into that answer, it probably is somewhat correlated to the value of the response to the user, which might make it easier to put on the other side of a video. In both of those cases, I do believe that it can unlock a greater amount of TAM for the LLMs in the sense that they can participate in top-of-the-funnel activity and bottom-of-the-funnel activity, which is different than what search has done.
p. 11 · Read in context →
Asked whether to move into the sell side, he draws the permanent boundary of the business model — and why OpenPath is not that.
Jeffrey Terry Green (CEO and Co-Founder): Coming to the second part of your question, which was about should The Trade Desk, Inc. get into the supply side: the reason we have not is not because we could not technologically. It is not because it would not further shorten the supply chain. It is because we do not want to create the conflict of interest of saying to one group of customers, we want you to get the lowest CPM cost, we are looking for value, and then going straight from advertisers to publishers saying, we want to give you the highest CPM possible, and then trying to serve two masters. This is the flaw of every ad network business model, which, by the way, hundreds of companies are trying to replicate in a lot of ad tech business models today—the flaws of the ad network business model that we disproved twenty years ago. This is a lesson that unfortunately not enough have learned. That said, there are hundreds of publishers who want to do their own yield management, and many companies in CTV are doing their own yield management. They built their own tech to do this, and we plug into that tech directly. This is the reason we built OpenPath in the first place: to plug into companies like that who want to do their own yield management. So we will absolutely look for that opportunity. But as it relates to going all the way to the sell side and doing the yield management for them, we will never do that.
p. 11 · Read in context →
Q4 and Full Year 2025 Earnings Call — Q4 FY2025
The annual framing call — the CPG and auto drag quantified, the take-rate bear case answered, and OpenPath's fee disclosed. · Open the full transcript →
A head-to-head test against the Amazon DSP, quantified — the cleanest illustration of what owning no inventory is worth.
Jeff Green (CEO): Let me give you a couple of examples of how the supply-demand imbalance has helped us. One of the world's leading appliance manufacturers recently ran a test between The Trade Desk and the Amazon DSP, focusing on CTV ad performance in one of their most important markets. They found that, with The Trade Desk, they were able to reach 70% more unique households because we gave them access to a much wider range of relevant touch points with those consumers. With The Trade Desk, they were able to reach those consumers at 30% lower total cost, so significantly better reach for meaningfully lower cost. And the kicker is The Trade Desk platform performed six times better in terms of delivering their campaign goals. All of this happened because we provided the client with objective decisioning across the open Internet. We didn't prioritize our own impressions because we don't own any. We were able to help the client find the ad impressions that were most likely to lead to conversions.
p. 2 · Read in context →
Why the third-party data market stayed small, and the flat-fee structure meant to fix it — a pricing model laid out first here.
Jeff Green (CEO): I have argued that the data marketplace is anemic for one primary reason. There is no price discovery for data. The cost has really been complicated for marketers, so generally, they don't use it. We can see, though, that the value is obvious, especially leveraging AI. And using a flat cost structure, Audience Unlimited helps advertisers use a wider range of the most relevant data to any given campaign for an all-in cost, where value and impact is clearly understood. This innovation wasn't possible before advances in AI, particularly Agentic AI in this case, which allows us to surface the right data segment at the right moment. Of course, Audience Unlimited is completely optional. Clients can use it or continue to buy third-party data a la carte. We are already seeing very positive results with early adopters, and I'm excited for more advertisers to get access as this year progresses.
p. 4 · Read in context →
Management's answer to the decade-old take-rate compression bear case, stated plainly.
Jeff Green (CEO): Finally, I'd like to zoom out and provide a little more perspective. For as long as we've been public, which is around ten years now, there's been a narrative that our margin or take rate must compress because other platforms offer lower upfront prices for non decisioned, non-data-driven buying. In reality, those business models deliver less value overall. Their business model is focused on selling owned and operated inventory. Walled gardens can more than make up for the lower fee on supply side as they mark up and prioritize their owned and operated inventory.
p. 5 · Read in context →
Why he rejects the brand-versus-performance split, and what last-touch attribution does to top-of-funnel spend.
Jeff Green (CEO): There is this narrative on Wall Street that performance budgets are more DTC or they're more mid-market and then there's brand budgets that are separate from that. That paradigm, I just reject. I think everything is performance now; it's just a matter of where you are in the funnel. The problem with framing it that way is you reinforce a serious problem in the ecosystem, which is that all of the measurement frameworks that have existed to date just give credit to the last person who touched the ball before it went in the net. The rest of the team gets nothing. In the brand-building business, it is by its very nature at the top of the funnel where you win hearts and minds; it tends to be more expensive media. Nobody types in 'Buy Mercedes-Benz' into Google without seeing the commercial or hearing about the company before that. Giving all the credit to the last touch has been a serious mistake. Brands like Hershey’s and others are creating a better framework to reward the things that matter and make everything perform. Of course, the players on the back of the field—if we're using the sports analogy, the goalie and the defender—they matter as much as the striker. But let's not just give all the money to the person who kicked the goal. Otherwise, we all play sports like five-year-olds. We hover around the ball and try to be the last one to touch it before it goes in. That, unfortunately, is too often the state of marketing.
p. 13 · Read in context →
Q3 2025 Earnings Call — Q3 FY2025
The best single explanation of the products and the market structure: what each supply-chain tool does and why a rival pricing to zero doesn't scare him. · Open the full transcript →
The definition the whole thesis rests on: the open internet is where price discovery exists because buyer and seller are different entities.
Jeff Green (CEO): A reminder, the open Internet is the portion of the Internet where price discovery and competition exists. In the open Internet, every transaction is arm's length. Walled gardens are built around owned and operated inventory instead of third-party inventory. Price discovery comes when the buyer and seller are different entities.
p. 1 · Read in context →
Antitrust-trial evidence used to argue DV360 became a YouTube buying tool — the competitive claim with numbers attached.
Jeff Green (CEO): Nearly every big tech player in advertising, Amazon, Apple, Google, Facebook, is primarily focused on expanding and monetizing their owned and operated inventory and content. Google is clearly focused on search, their AI chatbot Gemini, and YouTube. Amazon's primary advertising efforts are focused on growing sponsored listings, and secondarily on Prime Video. Both are putting Amazon-owned and operated inventory first. Facebook continues to focus on monetizing Instagram and Facebook as destinations, and TikTok the same. None of these companies are focused on monetizing the open Internet. This was helpfully made public throughout the antitrust trial of the Department of Justice versus Google when they revealed numbers that Google normally does not report on. Exhibits and industry experts estimated that in 2019, the open Internet and owned and operated inventory on YouTube were equally split in share of wallet on DV360. However, between 2019 and today, roughly all of the incremental dollars and growth from DV360 has gone to YouTube. YouTube spend increased by about 800%, while Google's buying of the open Internet stayed essentially flat for the same period of time. During that time, the Trade Desk seems to have surpassed Google in the amount bought on the open Internet, again, according to others.
p. 2 · Read in context →
Kokai adoption and the measured performance delta versus the prior platform — the case for why clients migrate.
Jeff Green (CEO): Today, nearly all of our clients have tried Kokai, with nearly 85% using Kokai as their default experience. When we build a new iteration of our platform, our primary goal is to deliver more value to our customers by increasing their performance. By this standard, Kokai is the best upgrade we have ever made to our product relative to all previous versions and certainly relative to Solimar. Campaigns that have switched to Kokai are seeing impressive results. Since its launch, Kokai has delivered, on average, 26% better cost per acquisition, 58% better cost per unique reach, and a 94% better click-through rate compared to Solimar.
p. 3 · Read in context →
The supply-chain product stack explained in one pass: what OpenPath, OpenAds, Pubdesk and Deal Desk each do.
Jeff Green (CEO): This year, we've launched and grown several products that are solely focused on substantially upgrading supply chains so that buyers get more for their money. OpenPath is an integration between TTD and a direct source of inventory. OpenPath plugs into auctions we trust. It is a collection of clean pipes for connections that are directly into inventory. We have grown OpenPath by many hundreds of percentage points this year, which means our clients are getting clear views of exactly what they're buying, and publishers have a clearer sense of what advertisers are willing to pay when they describe their inventory in a transparent and accurate way. OpenAds is an auction that we develop and sometimes host as an option for publishers. We then bid into a fair auction and even enable other buyers or DSPs to do the same thing too. The market needs a healthy auction, and some sell-side players have continually weakened the integrity of the auction. So we're developing an open-source option that raises that bar. We just launched it, and we're already working to integrate with more than 20 of the biggest publishers on the web. We expect this to dramatically improve the supply chains of mobile in-app ads and browser-based ads, which, of course, can use the help in an AI scraping world. Pubdesk is improving the supply chain by publishing data for the sell-side. Resellers, sellers, and publishers can log into the platform and see what we paid the supply chain, what signals we value, and adjust their sites and inventory to get more. This is largely fueled by the Sincera team and data that we acquired earlier in the year. Deal Desk is a better way to manage one-to-one deals. Not only does it facilitate the buy, but using AI, it predicts how a deal will perform relative to the open market. This product enables them to do deals, but also gives them the unprecedented data and tools to avoid bad deals. It is important to note that this product will be foundational to a healthy forward market that can replace the outdated upfronts.
p. 4 · Read in context →
Amazon's ad revenue decomposed — sponsored listings versus Prime Video versus DSP — to argue the overlap is small.
Jeff Green (CEO): Amazon has made significant strides in advertising recently, and it's important to take a closer look at their approach. This year, they're projected to generate around $70 billion in advertising revenue. Based on our analysis, it appears that approximately 90% of this revenue comes from sponsored listings, likely more than 95%. In my opinion, these sponsored listings are in direct competition with Google Search and the new AI-driven search engines. Amazon’s advertising efforts are focused on competing with Google, which is driving most of their advertising revenue and growth. The second source of their advertising revenue is Prime Video, which we estimate generates a couple of billion dollars at most, significantly less than that 10% of their total advertising revenue. This revenue source competes with platforms like Netflix, Disney, and Paramount. While their advertising growth is impressive, the story of Amazon's advertising primarily revolves around their growth in owned and operated ad inventory. Their demand-side platform (DSP) is definitely a lower priority. To clarify, our DSP targets a crucial question in advertising: what ads should brands or advertisers purchase on the open Internet? Ideally, we define DSPs as platforms for purchasing across the open Internet. Amazon's DSP, however, is primarily focused on buying ads for Prime Video, with minimal investment geared towards the open Internet. Our estimates indicate that only a small fraction of their DSP activities involve decision-making for the open Internet; the majority is either for Prime Video or nondecision buying such as programmatic guaranteed. In my estimation, close to 97% to 99% of Amazon's advertising efforts center around monetizing their owned and operated inventory, with only a small portion dedicated to the open Internet. In the advertising space, Amazon competes first with Google and then with Netflix and Disney, leaving us with minimal competition.
p. 8 · Read in context →
Asked whether rivals can simply price the DSP at zero, he gives the answer he has given since the IPO roadshow.
Jeff Green (CEO): Shyam, let me also just answer the other part of your question that you directed towards me, by the way, extra points for the multipart question. I just wanted to also answer the part about the question on pricing. I actually love this question as well in part because when we were on the IPO roadshow, I remember getting into a discussion with a very large room full of people, where one of the— in my view, one of the smarter PMs on Wall Street asked the question, doesn’t, in the end, Google just kick your app because they can price it at zero? I will answer it now the exact same way that I answered it then, which is something to the effect of — I hope they do eventually price it at zero because it will be easier to point out then the problem of advertising today. Google doesn't break out the money they make from their DSP buying the open Internet because the Google P&L — this isn't material on the Google P&L. They make their money in other ways. So pricing the DSP at zero will inspire the question, is this a trick? If you make the DSP zero, where are you making your money? In my opinion, DSPs that price at near zero or at discounts to get close to zero only do that because they're primarily selling owned and operated inventory that has a cost of goods sold of near zero, and that's where they make the money. So when we orient the conversation around price, I think it's a trap for us and the buyers. If we orient the conversation around value, we win nearly every time.
p. 9 · Read in context →
Q1 2025 Earnings Call — Q1 FY2025
The recovery quarter, where the founding thesis, the OpenPath economics and the post-reorg evidence are all set out together. · Open the full transcript →
The founding thesis restated from the original business plan: few scaled DSPs, most conflicted, one objective winner.
Jeff Green (CEO): I want to share something that we put in The Trade Desk business plan 16 years ago, before we'd written even a single line of code. We argued to potential investors then that at the end state, there will be 10 or fewer scaled DSPs. We think most of them will be conflicted. We thought then that most DSPs would compromise their objectivity with buyers in order to promote their own content. Walled gardens bias their own content at the expense of media buyers who look to seek value and performance across the entire ecosystem. Their business models are inherently flawed because over the long-term, their fiduciary duty to grow for shareholders is at odds with what is in the best interest of the agencies and advertisers, which is to objectively buy media from all over a competitive, massively scaled digital media landscape where no single company can possibly own all of the good media.
p. 2 · Read in context →
The guidance philosophy in a downturn — measure the quarter in share taken, not growth delivered.
Jeff Green (CEO): When the large brands are facing comparatively tough times, we are focused on grabbing land. In macro environments with headwinds, our short-term success is better measured in how much land we grab. In this environment, we want to win market share from our competitors. We did the same thing during the pandemic. While consumers stayed home to stay safe, they also accelerated their move to streaming. We adjusted our business to work-from-home, and we grabbed land. In other words, we won share from everyone else.
p. 2 · Read in context →
OpenPath's results on the publisher side, and the explicit limit: it is not a move into the sell side.
Jeff Green (CEO): We are seeing example after example of the benefits that OpenPath is providing. Arena Group publishes major titles such as Men's Journal and Parade. They boast more than 100 million visitors per month. With OpenPath, they were able to increase their fill rates by 4x and improve programmatic revenue by 79%, all because they are able to provide advertisers, our clients, with clear visibility into what they're buying. I could list dozens more examples. The New York Post saw its digital advertising fill rate increase more than 8x, and programmatic revenue increased 97% with OpenPath. In the world of CTV, VIZIO saw its programmatic revenue increase by 39%. And another major network saw their fill rate increase 7x, leading to a revenue increase of over 25%. To be clear, OpenPath does not represent The Trade Desk getting into the supply side of the market. OpenPath is not built to help publishers with yield management or ad serving.
p. 2 · Read in context →
The measurement gap that drives demand for the open internet, stated as a concrete example.
Jeff Green (CEO): Let me outline a conundrum that marketers are currently facing, and I hear this from CMOs and agency leaders on an almost daily basis. Walled gardens are easy to use, and marketers can use them for easy access to what I would call cheap reach, or put another way, let me reach as many people as possible as quickly and cheaply as possible, all as measured by those walled gardens themselves. The problem begins when the metrics provided by those walled gardens don't line up with actual business outcomes over time. So for example, walled garden measurement may tell an advertiser they've accounted for one million toothbrush sales this quarter, but they only actually sold half a million. Those measurement disparities over time create misalignment for marketers and the businesses they're supporting, all because of the attraction of cheap reach.
p. 4 · Read in context →
What clients actually get from the platform migration, in campaign metrics rather than adjectives.
Jeff Green (CEO): And across all verticals, clients that are adopting Kokai are realizing major benefits. For example, on average, clients that have shifted over have seen a 42% reduction in cost per unique reach. We're also working with clients beyond typical brand and reach metrics. Kokai is delivering on lower funnel KPIs, including 24% lower cost per conversion and 20% lower cost per acquisition. These improvements are helping unlock performance budgets from new and existing clients. And thanks to the work we've done in our data marketplace to increase the discoverability of third-party data, campaigns on Kokai use roughly 30% more data elements per impression.
p. 5 · Read in context →
One quarter after the miss, the specific evidence offered that the reorganization worked.
Shyam Patil (Susquehanna); Jeff Green (CEO): Can you elaborate on the progress that you're seeing from the product and go to-market changes that you implemented towards the end of last year? I mean, it sounds like those efforts are beginning to gain traction and contributed pretty meaningfully to the strong start. […] I want to highlight a couple of green shoots we're observing. Kokai adoption picked up momentum as we exited December, and now about two-thirds of our clients are utilizing Kokai, which is ahead of our timeline. Additionally, we’ve focused on integrating AI across the platform, making significant strides in the last quarter like never before in our company's history. Since we started introducing Koa in 2017, these investments in AI and our platform improvements, including Kokai, have led to outstanding campaign performance. Kokai is achieving lower funnel KPIs, such as a 24% reduction in cost per conversion and a 20% decrease in cost per acquisition. These enhancements are unlocking performance and budgets from existing clients, as well as attracting new clients who are more performance-focused. Our product and engineering teams have become more collaborative and effective than they have been in years, and we now have over 100 scrums operating and delivering products weekly. The new reporting structures are successful and fostering greater engagement with brands and agencies. We have more work ahead and have yet to fully benefit from these upgrades, but the trend is promising, confirming that we’ve made the right decisions. Our strong JBP pipeline also supports this. Over 40% of our spending is now aligned with JBPs, which are partnerships built on long-term commitments and visions for collaboration, growing 50% faster than overall spending. This synergy enables our business to grow at a faster pace.
p. 7 · Read in context →
Why walled gardens can charge high take rates and still win on cost — the supply-chain economics the open internet must match.
Jeff Green (CEO): As it relates to OpenPath itself, it's been pretty amazing. We've just been in the market for a couple of years now, but we've been obsessed with improving the visibility and transparency of our supply chain. Really what we're trying to do is make certain that the supply chain is efficient. So if you just zoom out, really all we're trying to do is make it so that there aren't so many middlemen, so many taxes, especially those that don't add more value than they extract, so that the open internet isn't operating at a disadvantage. Because we always look at this as, to a large extent, this is the open internet competing against walled gardens. Walled gardens lose on objectivity, they lose on transparency, but in some cases, they've won on supply chain efficiency because they control it all. So even with really large take rates that they all have, their cost of goods sold is so low that they can make very healthy margins, and then they have short supply chains because they control those too. So in order to compete with that, we need a supply chain that is quite efficient.
p. 10 · Read in context →
Q4 and Full Year 2024 Earnings Call — Q4 FY2024
The call where the thesis was tested: the first shortfall in 33 quarters, what management blamed, and what it changed. · Open the full transcript →
The admission that broke an eight-year streak, and his framing of the cause as execution rather than market or competition.
Jeff Green (CEO): While we’re proud of these milestones, I want to acknowledge upfront that for the first time in 33 quarters as a public company we fell short of our expectations. During COVID, we revised our expectations once like many in the market, but for the first time in 8 years, we missed the expectations we set, and it was our fault. When we contemplated going public about 10 years ago, many advised against it, often due to concerns over low valuations because no ad tech company had earned Wall Street’s trust for an extended period. I saw that as a challenge and still do. I knew we had the business model, the total addressable market, the vision, the determination, and the team to break that mold and achieve what had never been done before. The only way to do that was to make commitments and follow through. Many said it couldn’t be achieved. Our success has been partially driven by our ability to earn the trust of investors, partners, our industry, and our clients. Few things are as important to us. I want to emphasize that we take this moment seriously. We assure our investors, partners, and clients that their trust is well-placed and deserved. Our best days lie ahead, but before discussing that, I want to share what went wrong and the changes we are implementing to mak the most of our unique and growing opportunity. To begin, let me clarify what falling short of our expectations does not signify. This wasn't due to a smaller opportunity than anticipated, nor did competition play a role. In Q4, we faced challenges due to a series of small execution missteps while also preparing for the future. If this were a sporting event, we would still have a championship caliber team, but in this particular instance, we made too many turnovers.
p. 1 · Read in context →
The four structural changes made in response — reorg, brand coverage, JBPs, and a rebuilt engineering process.
Jeff Green (CEO): First, we implemented the largest reorganization in company history in December. While we usually make structural changes at year-end to enhance our business, this one was larger than usual. We clarified roles and responsibilities for most employees, resulting in a change in reporting structures. Additionally, we streamlined client-facing teams, minimizing complexity and clarifying duties. Some teams now focus on brands, while others concentrate on agencies. Our commitment to agencies remains strong, while we expand direct relationships with brands, particularly through Joint Business Plans, which grow 50% faster than the rest of our business. […] Fourth, we revamped our product development process, returning to smaller, agile teams that provide weekly updates instead of relying on waterfall methods, which are less suitable for our fast-changing industry. Our engineering team is divided into nearly 100 scrum teams, enhancing collaboration with the business team on what has been accomplished and what’s upcoming. I anticipate this will continue to boost Kokai enhancements and complete the transition of all clients from Solimar to Kokai this year.
p. 2 · Read in context →
The CFO's own account of the miss, plus the take-rate disclosure investors watch most closely.
Laura Schenkein (CFO): However, for the first time, in our 8.5 years as a public company, excluding the first quarter of 2020, our results came in below our expectations. As a company, we take great pride in our ability to forecast accurately, and we take full ownership of this shortfall. Importantly, this miss was not due to lack of opportunity or increased competition, it was on us. We are implementing the strategic changes Jeff outlined in our business and I believe that will give us an opportunity to continue delivering strong revenue growth throughout this year and beyond. For 2024, we ended the year with $12 billion in spend on our platform and $2.4 billion in revenue, representing a 26% increase in revenue year over year. Full year adjusted EBITDA margin was above 41% and full year free cash flow was over $630 million. As expected, our take rate in 2024 once again remained within a very consistent historical range.
p. 5 · Read in context →
The first and hardest question of the call — what went wrong — and the answer given to a long-time covering analyst.
Shyam Patil (SIG); Jeff Green (CEO): Hi, Jeff, as you know, I've been covering you guys since you've been public and following the company long before that. And until now, for over eight years, you guys have had an amazing run where you've hit your guidance every single time. Just wondering, can you just talk about what went wrong in the fourth quarter where you guys came in below your expectations. Thank you. […] I acknowledge that we fell short of our expectations, which is different from missing Wall Street's projections. When we outline our guidance, it feels like a commitment to us. It's understandable for shareholders to question what this means for our potential. I want to clarify that our shortfall was due to a series of minor execution errors. We were trying to execute while preparing for the future, leading to several small mistakes that compounded. To draw a comparison, we have a championship-caliber team, as proven over the past eight years, but we turned over the ball too many times this time, resulting in our loss.
p. 6 · Read in context →
Where he concedes the org was thin — no COO — and the TAM arithmetic he points to for reacceleration.
Jeff Green (CEO): I want to highlight one area where I believe we can enhance our team. I’m very proud that we have achieved this for 32 quarters in a row. While I’m disappointed we didn’t succeed this time, we anticipated that eventually we would miss. I’ve encouraged the team, and I’m eager to show everyone what comes next; we know people will be watching our response. I am genuinely thankful for this experience. I think we need to continue expanding our team and looking for ways to improve our go-to-market strategy. Unlike basketball, where you can only have five players on the court, in business, we have the opportunity to add more people to our team. I see potential for us to become more efficient. We have managed to operate without a COO for a while, and there is no reason we shouldn’t bring in a top-tier COO. As we aim for greater operational rigor, we will need someone to assist us in that effort. This is an obvious area for us to improve our operational efficiency. […] We have a $1 trillion TAM. We currently control a little over 1% of it. We think we have 98% of the TAM left, and the CTV should be fast-growing outside the United States should be growing faster than the United States for obvious reasons. Audio is untapped. I think Spotify highlighted this in their earnings. I think there's a tremendous opportunity for them and for us and for the open Internet. That can come from that. I think there's a lot of inefficiencies in the supply chain, but now we're just at the right size where we can change it, where we're big enough to create changes. And those are four of them, but honestly, I think I'm leaving out a whole bunch of them.
p. 12 · Read in context →
More calls
Q2 2025 Earnings Call — Q2 FY2025 · 12 pages · The fullest single answer on Amazon as competitor versus potential partner, plus mid-year Kokai adoption and the Deal Desk beta. · Open →
Q3 2024 Earnings Call — Q3 FY2024 · 14 pages · The ten macro tailwinds framework that management referenced for the next year running — the pre-miss statement of the growth case. · Open →
Q2 2024 Earnings Call — Q2 FY2024 · 13 pages · Go here for the UID2 and retail media build-out at the peak of the 26%-growth era, before the Kokai migration slipped. · Open →
Q1 2024 Earnings Call — Q1 FY2024 · 13 pages · The Kokai rollout and UID2 adoption described while everything was still on plan — a useful baseline against later calls. · Open →
Q4 and Full Year 2023 Earnings Call — Q4 FY2023 · 19 pages · Prepared remarks only, but the fullest early statement of the CTV and retail media strategy that later chapters build on. · Open →
Q2 2023 Earnings Call — Q2 FY2023 · 21 pages · Where Kokai is introduced as the platform overhaul — the origin of the migration that dominates 2024 and 2025. · Open →
Q1 2023 Earnings Call — Q1 FY2023 · 22 pages · The original case for OpenPath and supply path optimization, laid out before it became a contested initiative. · Open →
Q4 and Full Year 2021 Earnings Call — Q4 FY2021 · 21 pages · The Solimar, UID2 and Walmart DSP era — how management framed the platform and identity bets at the start of the decade. · Open →
The Trade Desk, Inc.'s annual reports contain management's most considered account of the business. These are the sections, passages and visual pages worth opening in the originals preserved in Sources.
The Trade Desk, Inc. — FY2025 Annual Report (Form 10-K) — FY2025 (year ended December 31, 2025)
The latest 10-K: revenue +18% on gross spend +11%, one segment, and a client base where two holding companies each cleared 10% of billings. · Open the full document →
Item 1. Business — Overview and Our Industry — p. 7 · Read the full section →
Management's own definition of the business and the fee model: a percentage of client platform spend, plus value-added services and data.
What TTD sells, to whom, and exactly what it charges for.
We are a global leader in advertising technology. We empower ad buyers to create, manage and optimize digital advertising campaigns across ad formats, channels and devices. Our platform’s depth, artificial intelligence (“AI”) capabilities and rich ecosystem of inventory, publisher and data partner integrations enable superior reach and decisioning for clients. […] Our clients are advertising agencies, advertisers and other service providers for agencies or advertisers, with whom we enter into ongoing master services agreements (“MSAs”). We generate revenue by charging our clients a platform fee generally based on a percentage of our clients’ total platform spend and from providing value-added services and data to support their advertising campaigns.
p. 7 · Read in context →
The four demand trends management is underwriting: CTV, a $1 trillion ad TAM, AI and privacy-era data.
Digital advertising is reported to represent the largest and fastest-growing segment of the global advertising industry, with estimated annual spend of over $700 billion and representing more than 70% of the total market spend. […] Rapid Growth of CTV. We are witnessing a generational shift from linear television to connected television (“CTV”) as Internet and television programming converge. […] Expansion of Global Advertising TAM and Programmatic Advertising. The total addressable market (“TAM”) for global advertising is reported to have surpassed $1 trillion for the first time in 2024. […] AI Driven Personalization and Automation. AI is fundamentally changing the media landscape, from the creative process all the way to the execution of advertising campaigns.
p. 7 · Read in context →
Item 1. Business — Our Clients and Our Advertising Inventory and Data Suppliers — p. 16 · Read the full section →
Both sides of the platform in numbers: 60-day-cancellable MSAs and two >10% holding companies against 430 supply integrations.
Contract terms, holding-company concentration, and the size of the supply and data ecosystem.
Our MSAs, some of which may include joint business plans and other incentive programs, do not contain any material commitments on behalf of clients to use our platform to purchase ad inventory, value-added services or data. Generally, these MSAs have one-year terms that renew automatically for additional one-year periods, unless earlier terminated, and are terminable at any time upon 60 days’ notice by either party. […] If all of our individual client contractual relationships were aggregated at the holding company level, two holding companies would have each represented more than 10% of our gross billings in 2025 and one holding company would have represented more than 10% of our gross billings in 2024. […] We obtain digital advertising inventory from over 430 directly integrated ad exchanges, publishers and supply-side platforms, providing us with access to a breadth of programmatic advertising inventory across televisions, streaming devices, mobile devices, computers and digital-out-of-home devices. […] As of December 31, 2025, we have integrated our platform with more than 370 third-party data vendors whose products are available for purchase through our platform.
p. 16 · Read in context →
Item 1A. Risk Factors — Client Concentration and Access to Inventory — p. 24 · Read the full section →
The two supply-and-demand dependencies with named counterparties: agency holding companies on one side, Google on the other.
"The loss of advertising agencies, advertisers or holding companies as clients" — two exceeded 10% of 2025 gross billings.
Our clients include advertising agencies, many of which are owned by holding companies, where decision making is decentralized such that purchasing decisions are made, and relationships with advertisers are located, at the agency, local branch or division level. If all of our individual client contractual relationships were aggregated at the holding company level, two holding companies would have each represented more than 10% of our gross billings for 2025. […] A holding company may be acquired by, or consolidate with, another holding company that does not utilize our platform, or a holding company may choose to exert control over its individual agencies in a way that may otherwise result in an overall reduction in our revenue. If so, any consolidation of, or loss of relationships with such holding companies and consequently, of their agencies, local branches or divisions, as clients could significantly harm our business, financial condition and results of operations.
p. 24 · Read in context →
Item 1A. Risk Factors — Identifier Dependence and Agency Payment Terms — p. 38 · Read the full section →
Two structural exposures: TTD does not control the identifiers its targeting relies on, and agencies owe it only what advertisers pay them.
"Third parties control our access to unique identifiers" — the dependency behind the whole targeting stack.
Third parties control our access to unique identifiers, and if the use of “third-party cookies” or other technology to uniquely identify devices or users is rejected by Internet users, restricted or otherwise subject to unfavorable regulation, blocked or limited by preference signals, technical changes on end users’ devices and web browsers, or our clients’ ability to use data, including on our platform or related offerings is otherwise restricted, our performance may decline, and we may lose advertisers and revenue. […] For example, if publishers or supply-side platforms decide to limit the data that we receive in order to comply (in their view) with state privacy laws, a potential federal privacy law or in response to other legal or industry developments, then our service may prove to be less valuable to our clients and we may find it more difficult to generate revenue. […] Digital advertising mostly relies on the ability to uniquely identify devices or users across websites and applications, and to collect data about user interactions for purposes such as serving relevant ads and measuring the effectiveness of ads.
p. 38 · Read in context →
Item 7. MD&A — Executive Summary — p. 77 · Read the full section →
The five numbers management leads with, and the opportunity list it says the spending is aimed at.
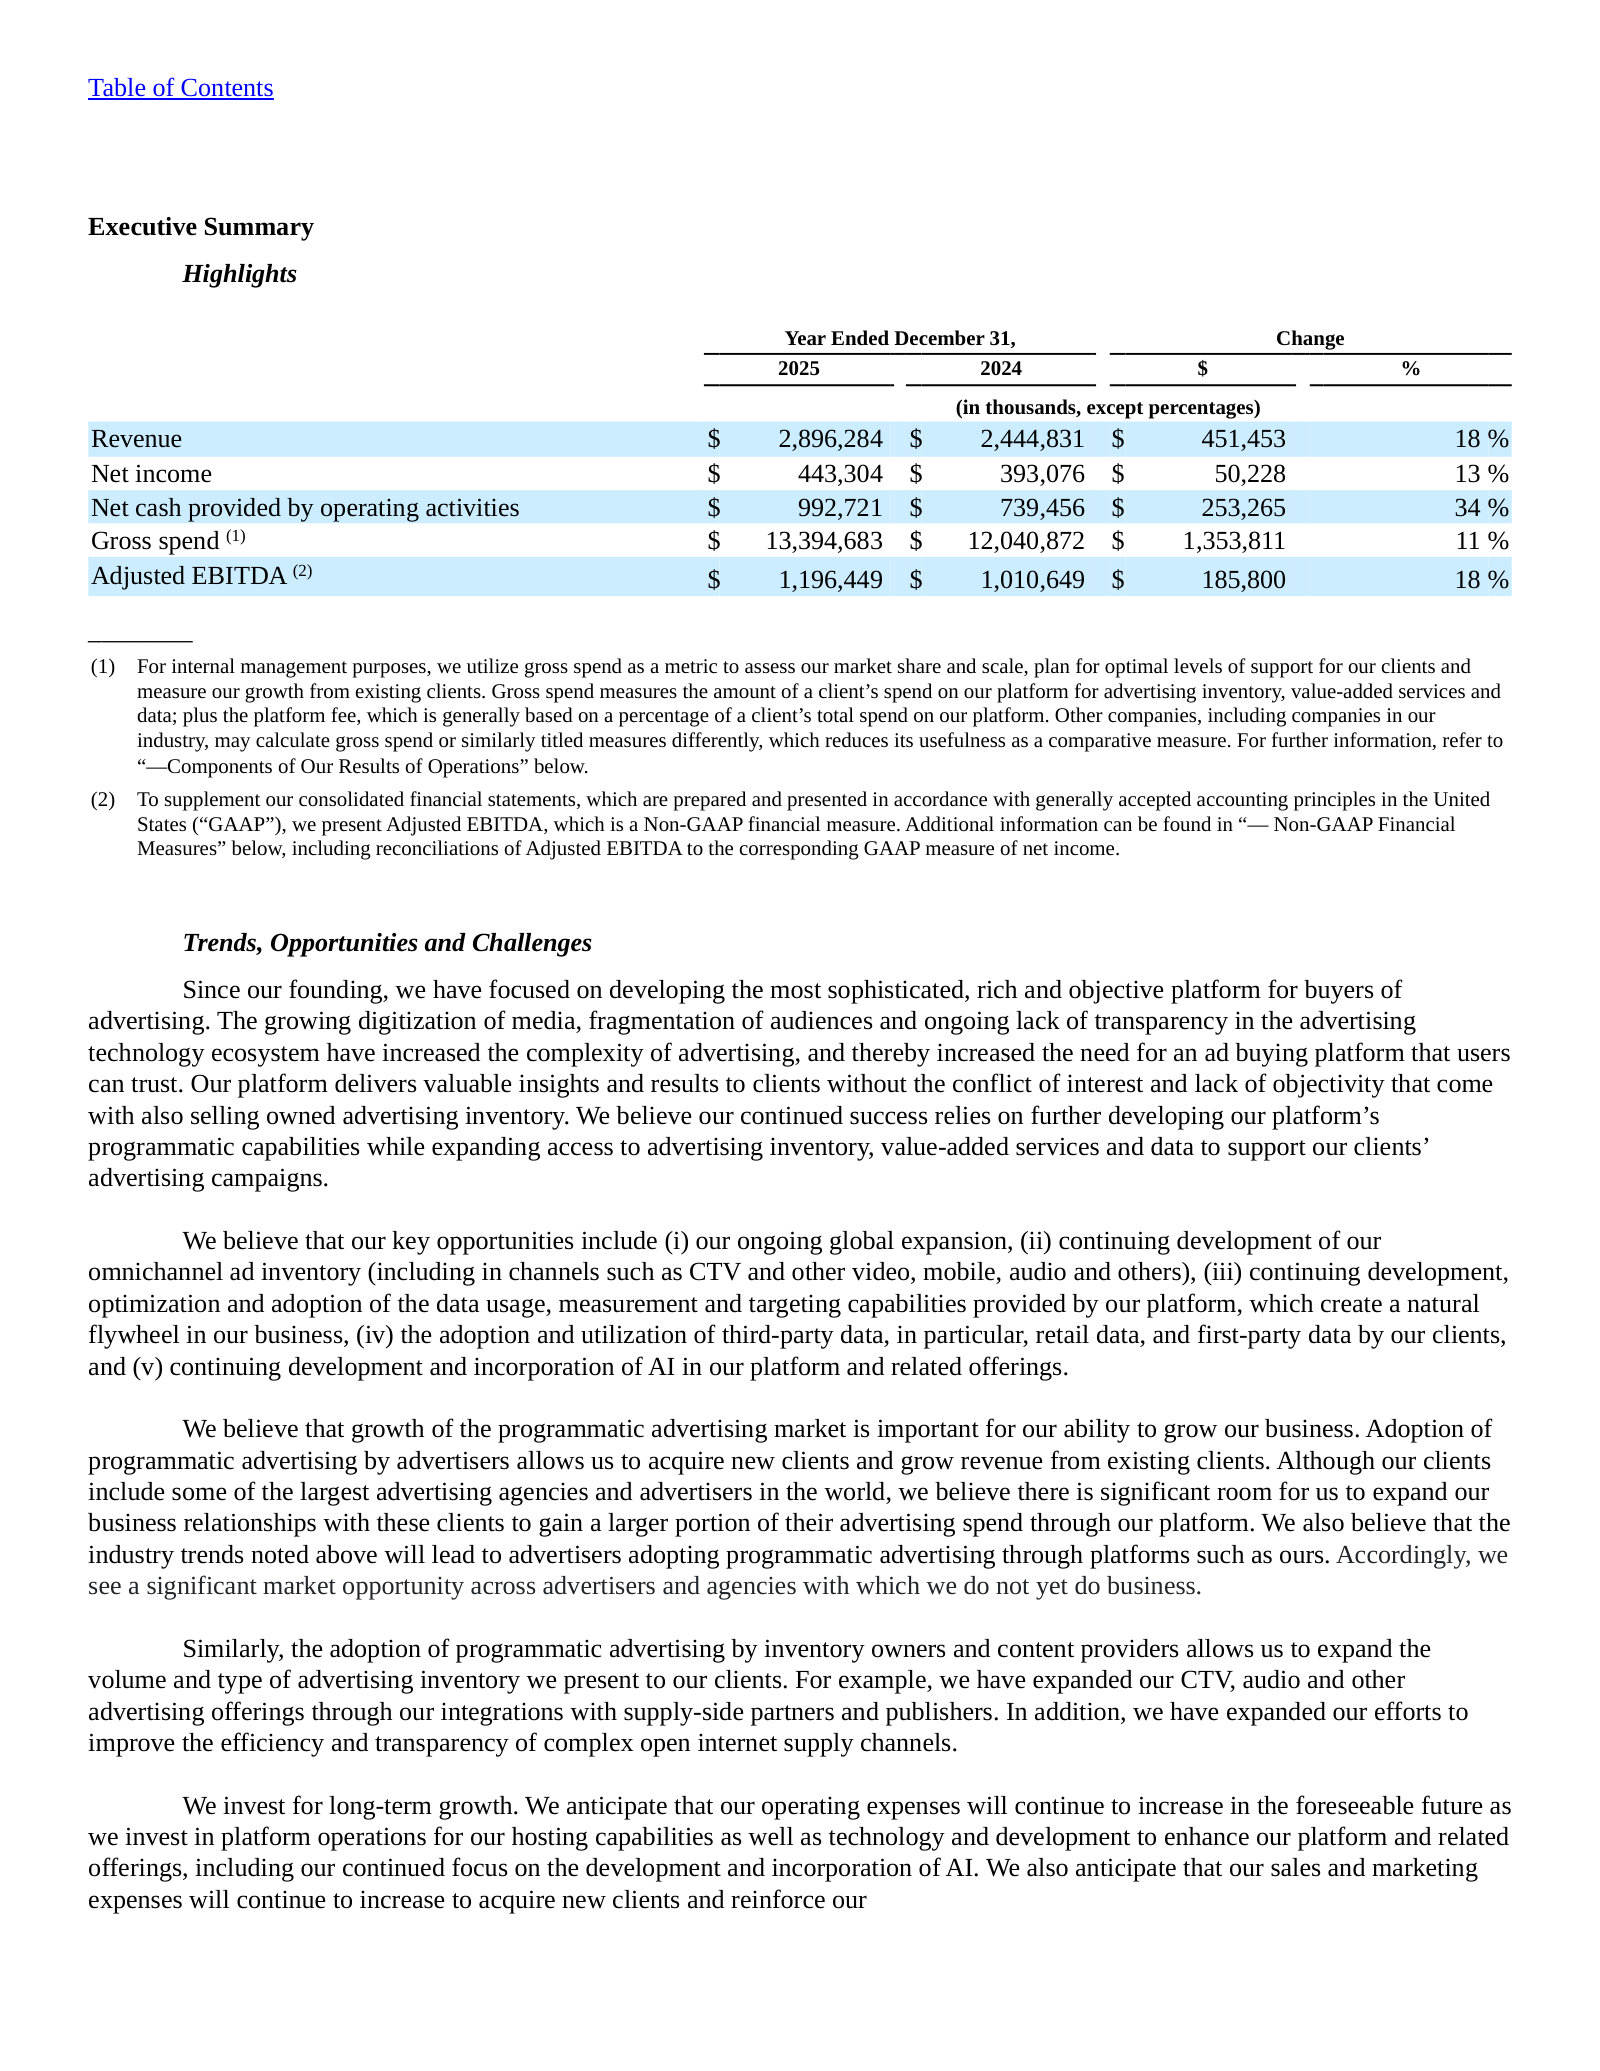
Item 7. MD&A — Components of Our Results of Operations — Revenue — p. 81 · Read the full section →
The accounting that defines the model: revenue booked as agent, net of supplier costs, which is why receivables and payables dwarf revenue.
One segment, net (agent) revenue recognition, and the reason the balance sheet looks outsized.
We have one primary business activity and one operating segment. […] We charge our clients for total spend on our platform, which includes spend and fees on advertising inventory, value-added services and data to support those purchases, in addition to the platform fee that is generally based on a percentage of our clients’ total spend on the platform. Generally, we report revenue as an agent on a net basis, which represents gross billings net of amounts we pay suppliers for the cost of advertising inventory, supplier-provided components of value-added services and data (collectively, “Supplier Components”). […] Accounts receivable is recorded at the amount of gross billings to clients, net of allowances, for the amounts we are responsible to collect; and our accounts payable are recorded at the amount payable to suppliers. Accordingly, both accounts receivable and accounts payable appear large in relation to revenue reported on a net basis.
p. 81 · Read in context →
Item 7. MD&A — Results of Operations for the Year Ended December 31, 2025, Compared with the Year Ended December 31, 2024 — p. 85 · Read the full section →
Revenue grew 18% on 11% gross-spend growth: management attributes the gap to pricing and higher use of value-added services and data.
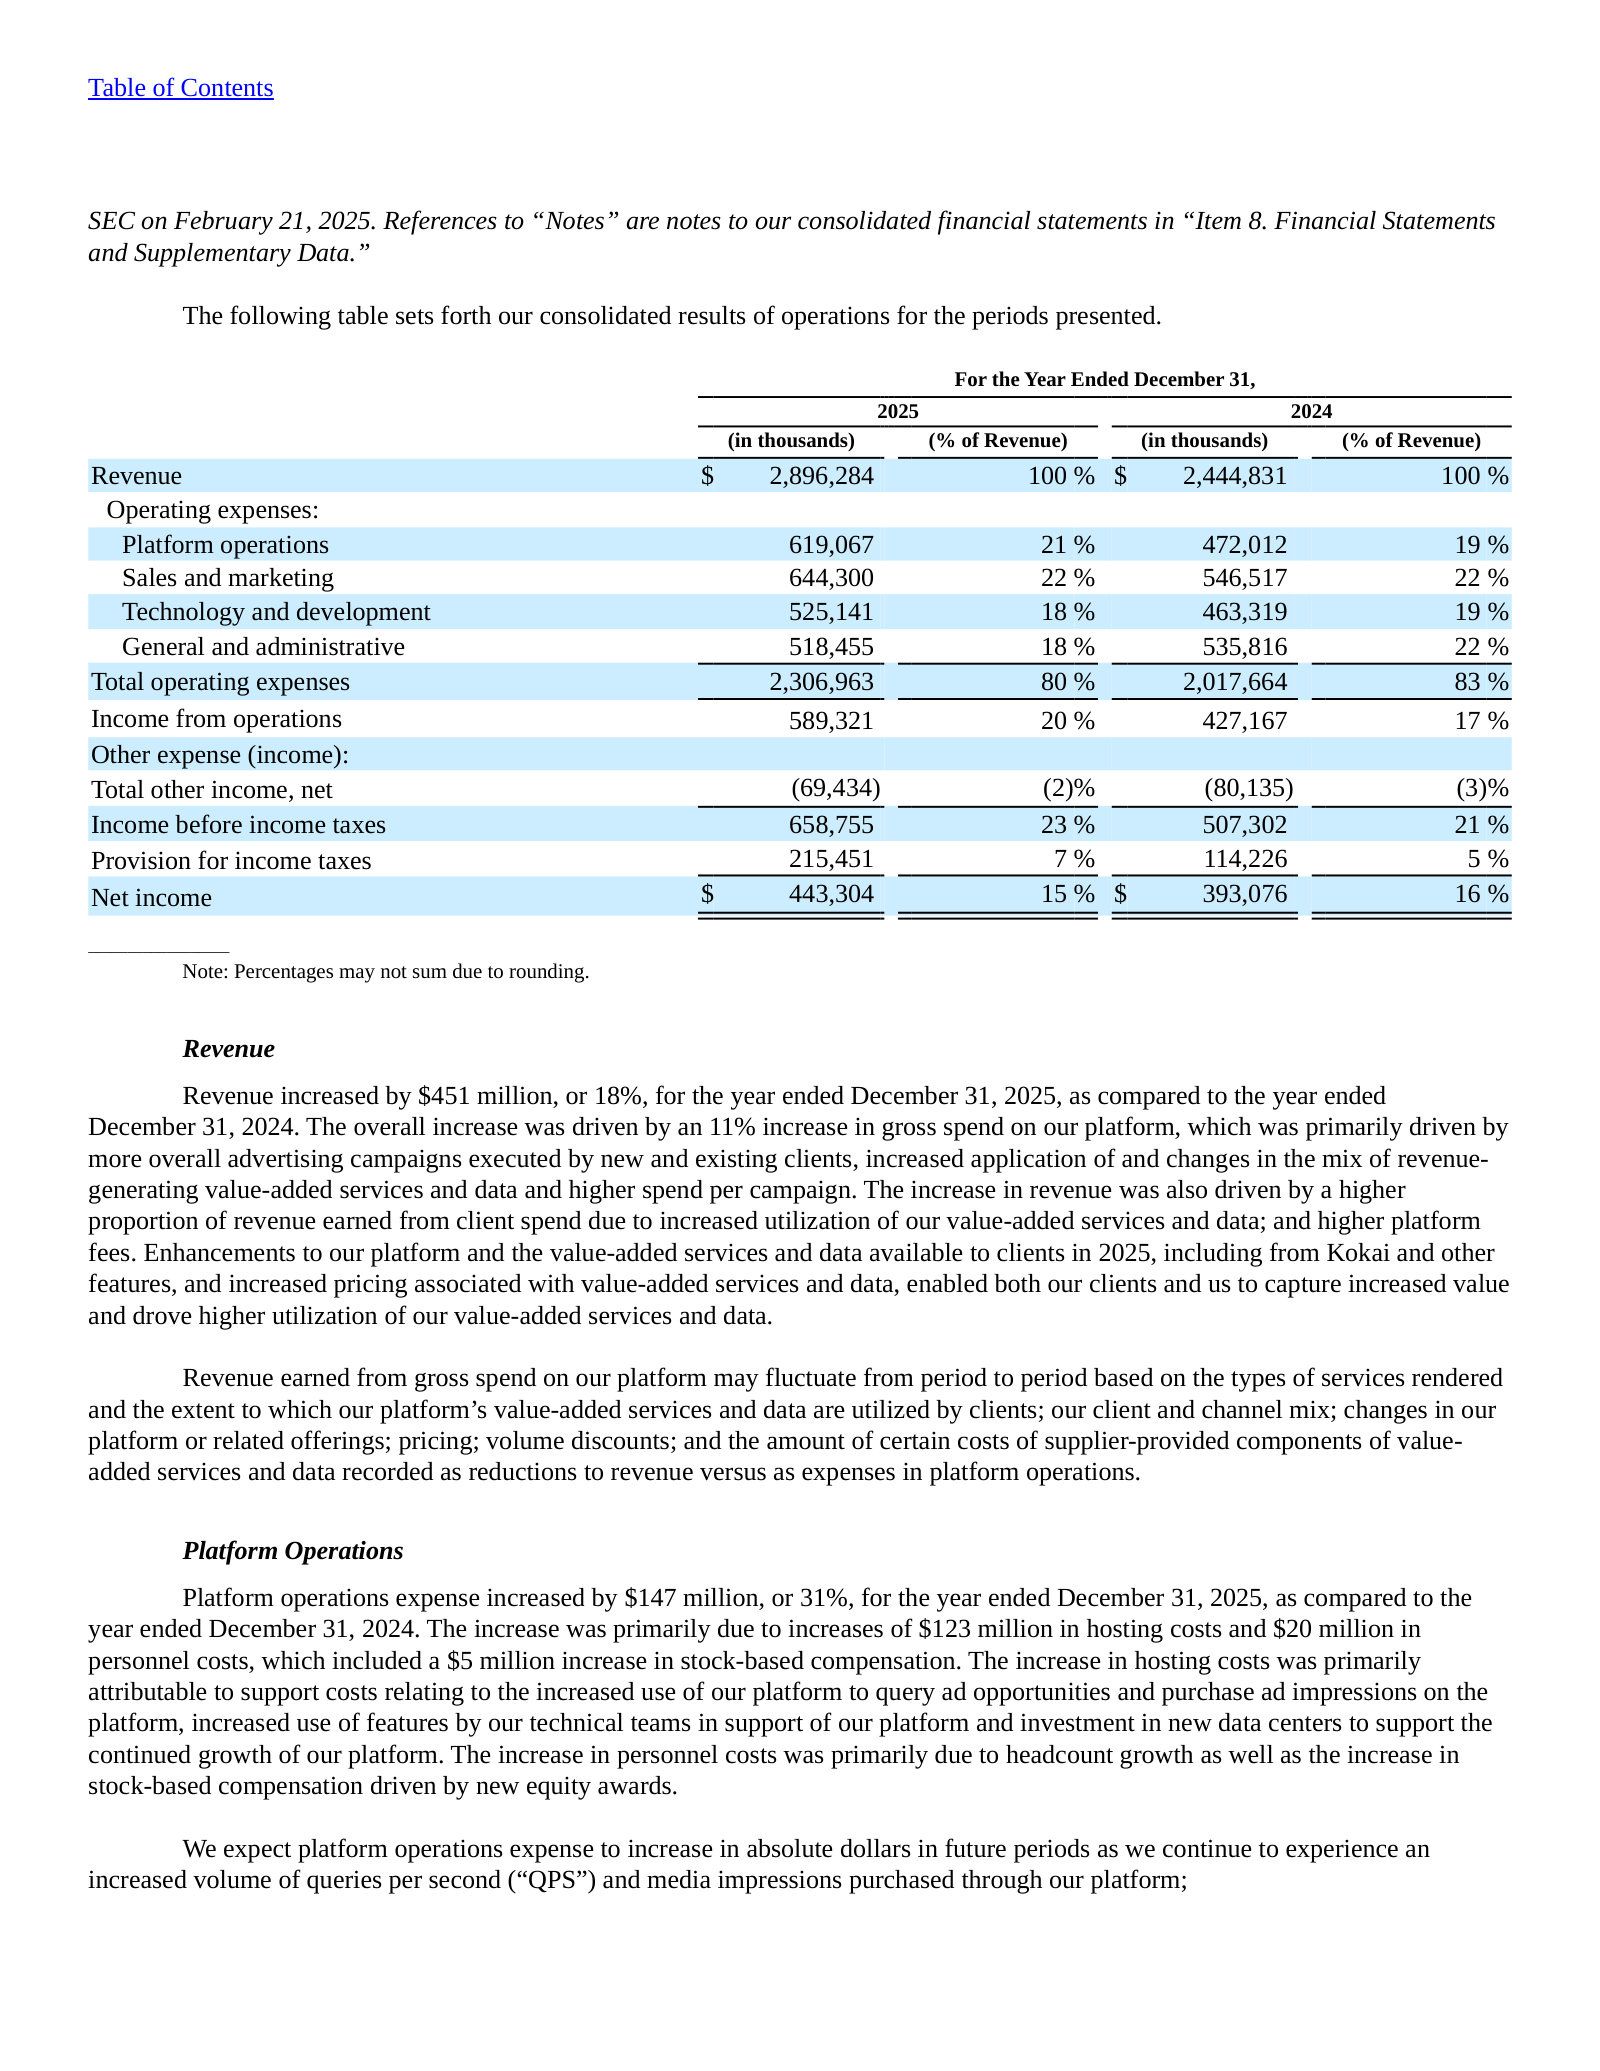
Management's explanation of the revenue-versus-spend gap: mix, utilization and pricing of value-added services and data.
Revenue increased by $451 million, or 18%, for the year ended December 31, 2025, as compared to the year ended December 31, 2024. The overall increase was driven by an 11% increase in gross spend on our platform, which was primarily driven by more overall advertising campaigns executed by new and existing clients, […] The increase in revenue was also driven by a higher proportion of revenue earned from client spend due to increased utilization of our value-added services and data; and higher platform fees. […] increased pricing associated with value-added services and data, enabled both our clients and us to capture increased value and drove higher utilization of our value-added services and data.
p. 87 · Read in context →
Note 12—Segment and Geographic Information — p. 145 · Read the full section →
Why there is no segment detail to analyze: one segment, the CEO reviews consolidated results only, and the US is 86% of revenue.
One reportable segment, and the disclosure that the CODM sees no expense detail below the income statement.
The Company’s chief operating decision maker is its Chief Executive Officer (“CEO”), who manages the Company and reviews financial information on a consolidated basis. The Company has one primary business activity, its advertising technology platform, as described in Note 1 – Nature of Operations. The platform is used by clients globally in a similar manner across geographies, channels and verticals. Accordingly, the Company operates in one operating segment on a consolidated basis: advertising technology platform. […] The CEO is not regularly provided significant expense information at a greater level of disaggregation than those expenses reported on the consolidated statements of operations.
p. 145 · Read in context →
The Trade Desk, Inc. — FY2022 Annual Report (Form 10-K) — FY2022 (year ended December 31, 2022)
Included for contrast: the pre-AI, pre-Kokai self-description, a Delaware incorporation, and a client-count metric TTD has since stopped giving. · Open the full document →
Item 1. Business — Overview — p. 6 · Read the full section →
The same business three years earlier: a "self-service, cloud-based ad-buying platform," no AI framing, and a Delaware corporation.
FY2022 self-description and fee model, against FY2025's "global leader in advertising technology."
The Trade Desk, Inc. (the “Company,” “we,” “our,” or “The Trade Desk”) offers a self-service, cloud-based ad-buying platform that empowers our clients to plan, manage, optimize and measure more expressive data-driven digital advertising campaigns. […] Our clients are advertising agencies, brands and other service providers for advertisers, with whom we enter into ongoing master services agreements (“MSAs”). We generate revenue by charging our clients a platform fee based on a percentage of a client’s total spend on advertising. We also generate revenue from providing data and other value-added services and platform features. […] The Trade Desk is a Delaware corporation established in 2009 and headquartered in Ventura, California.
p. 6 · Read in context →
Item 1. Business — Our Clients — p. 10 · Read the full section →
A disclosure since retired: over 1,000 clients on a defined $20,000 spend threshold, where FY2025 gives only holding-company concentration.
The client-count metric and its definition, dropped from later filings.
Our clients consist of purchasers of programmatic advertising inventory and data. As of December 31, 2022, we had over 1,000 clients, consisting primarily of advertising agencies or groups within advertising agencies that have independent relationships with us, manage budgets independently of one another, are based in different jurisdictions and are served by unique Trade Desk teams. Many of these agencies are owned by holding companies, where decision making is decentralized such that purchasing decisions are made, and relationships with advertisers are located, at the agency, local branch or division level. Our client count includes only those parties that have signed MSAs with us and have spent more than $20,000 on our platform.
p. 10 · Read in context →
More annual reports
The Trade Desk, Inc. — FY2024 Annual Report (Form 10-K) — FY2024 (year ended December 31, 2024) · 102 pages · The last 10-K before the 2025 derating: revenue $2.44 billion, filed two days after the first securities class action was brought. · Open →
The Trade Desk, Inc. — FY2023 Annual Report (Form 10-K) — FY2023 (year ended December 31, 2023) · 101 pages · Revenue $1.95 billion, and the first TTD 10-K to carry an Item 1C cybersecurity disclosure. · Open →
The Trade Desk, Inc. — FY2021 Annual Report (Form 10-K) — FY2021 (year ended December 31, 2021) · 127 pages · The year the CEO Performance Option was granted — the award that drove years of G&A charges and derivative litigation. · Open →
Source: S&P Capital IQ consensus via Xpressfeed · Generated 2026-07-25.
The forward tape has been marked down across the board over the past six months: FY2027 and FY2028 consensus is lower on both revenue and normalized EPS, and EPS has been cut harder than revenue in both years. The company keeps clearing the top line — seven revenue beats in the last eight quarters — but Q1 2026 normalized EPS landed 12.4% below consensus, the only double-digit miss in the visible record. Consensus still has revenue compounding at high single digits, while gross margin drifts lower and FY2026 free cash flow falls. The street reads as unresolved: 19 holds, and price targets spanning $11 to $38.
FY2028 EPS consensus is down 23% in 180 days and revenue down 18% — the whole forward tape has been cut
Most of the damage landed between the 180-day and 90-day marks; the last 30 days have been close to flat, with FY2028 normalized EPS unchanged. That EPS was cut deeper than revenue in both years means the downgrades run through profitability assumptions, not just the top line.
Currency: USD · Scale: money in millions, absolute · Point-in-time consensus; Δ90d is Now versus 90d.
| Metric | FY | 180d | 90d | 30d | Now | Δ90d |
|---|---|---|---|---|---|---|
| EPS (normalized) | FY2027 | $2.46 | $2.40 | $2.15 | $2.15 | -10.4% |
| EPS (normalized) | FY2028 | $2.92 | $2.72 | $2.24 | $2.24 | -17.7% |
| Revenue | FY2027 | $3.87bn | $3.66bn | $3.50bn | $3.48bn | -4.9% |
| Revenue | FY2028 | $4.51bn | $3.96bn | $3.76bn | $3.71bn | -6.1% |
Beat / miss record
Current sequences by metric: Revenue: 5 consecutive beats; EPS (normalized): 1 consecutive miss.
Currency: USD · Scale: money in millions, absolute · Consensus is captured before each actual first became effective.
| Quarter | Metric | Consensus | Actual | Surprise | Outcome |
|---|---|---|---|---|---|
| Q1 FY2026 | Revenue | $678.67m | $688.86m | +1.5% | Beat |
| Q1 FY2026 | EPS (normalized) | $0.32 | $0.28 | -12.4% | Miss |
| Q4 FY2025 | Revenue | $840.68m | $846.79m | +0.7% | Beat |
| Q4 FY2025 | EPS (normalized) | $0.58 | $0.59 | +1.7% | Beat |
| Q3 FY2025 | Revenue | $719.34m | $739.43m | +2.8% | Beat |
| Q3 FY2025 | EPS (normalized) | $0.44 | $0.45 | +1.8% | Beat |
| Q2 FY2025 | Revenue | $686.03m | $694.04m | +1.2% | Beat |
| Q2 FY2025 | EPS (normalized) | $0.41 | $0.41 | -0.9% | Miss |
| Q1 FY2025 | Revenue | $575.28m | $616.02m | +7.1% | Beat |
| Q1 FY2025 | EPS (normalized) | $0.25 | $0.33 | +33.2% | Beat |
| Q4 FY2024 | Revenue | $759.56m | $741.01m | -2.4% | Miss |
| Q4 FY2024 | EPS (normalized) | $0.57 | $0.59 | +3.6% | Beat |
| Q3 FY2024 | Revenue | $620.46m | $628.02m | +1.2% | Beat |
| Q3 FY2024 | EPS (normalized) | $0.39 | $0.41 | +4.3% | Beat |
| Q2 FY2024 | Revenue | $578.12m | $584.55m | +1.1% | Beat |
| Q2 FY2024 | EPS (normalized) | $0.36 | $0.39 | +9.5% | Beat |
FY2026: revenue up about 10% but consensus EBITDA up 5% and free cash flow down 5%
Consensus gross margin runs 76.7% in FY2026 against 78.7% in FY2025, and 73.6% by FY2029. Normalized EPS has one strong middle year (+16% in FY2027) before flattening to mid-single-digit growth in FY2028 and FY2029.
Currency: USD · Scale: money in millions, absolute · YoY uses the prior fiscal year from the feed; analyst count and range use the first displayed period.
| Metric | FY2025A | FY2026E | FY2027E | FY2028E | FY2029E | YoY | Analysts | Low / high |
|---|---|---|---|---|---|---|---|---|
| Revenue | $2.89bn | $3.18bn | $3.48bn | $3.71bn | $4.04bn | — | 37 | $2.85bn / $2.91bn |
| EBITDA | $1.17bn | $1.26bn | $1.38bn | $1.47bn | $1.55bn | — | 36 | $1.13bn / $1.24bn |
| EPS (normalized) | $1.76 | $1.85 | $2.15 | $2.24 | $2.33 | — | 20 | $1.68 / $1.84 |
| Gross margin | 78.7% | 76.7% | 76.8% | 75.9% | 73.5% | — | — | — |
| Free cash flow | $823.05m | $780.00m | $883.32m | $966.97m | $1.10bn | — | — | — |
36 analysts put FY2027 revenue anywhere from $2.63bn to $3.80bn, and the FY2027 EBITDA range is half the mean
FY2027 revenue carries 36 analysts and EBITDA 34, so the width is not a coverage effect. GAAP EPS is the widest line of all: $0.48 to $1.50 for FY2027 across 32 analysts.
Currency: USD · Scale: money in millions, absolute · Spread/mean is absolute high-low divided by absolute mean.
| Metric | Period | Mean | Low–high | Spread/mean | Analysts |
|---|---|---|---|---|---|
| Revenue | FY2027E | $3.48bn | $2.63bn–$3.80bn | 33.7% | 36 |
| EBITDA | FY2027E | $1.38bn | $821.00m–$1.51bn | 50.1% | 34 |
| EPS (GAAP) | FY2027E | $1.18 | $0.48–$1.50 | 86.5% | 32 |
| Revenue | FY2028E | $3.71bn | $2.41bn–$4.05bn | 44.1% | 20 |
| EBITDA | FY2028E | $1.47bn | $780.00m–$1.67bn | 60.4% | 18 |
Street snapshot
The mean target is $24.32 and the median $24.50 across 30 estimates, so the average sits near the middle of a wide band. Four analysts carry sell or underperform ratings and none is marked no opinion.
Currency: USD · Scale: money in millions, absolute · Analyst counts shown explicitly.
| Street view | Reading | Analysts |
|---|---|---|
| Recommendation mix | Buy 11, Outperform 2, Hold 19, Underperform 1, Sell 3 | 36 |
| Consensus score | 2.53 | 36 |
| Target price | mean $24.32; median $24.50; high $38.00; low $11.00 | 30 |
Visible Alpha broker models via S&P Xpressfeed · 31 brokers · 319 line items · freshest revision 2026-07-21.
Coverage is deep and the headline is not really in dispute: 29 brokers model FY-2027 revenue and the quartile band around it is tight. What the models disagree on sits underneath, in the gross spend base and the take rate that converts it. The FY-2026 revenue step-up is priced rather than volume-led — median take rate moves from 20.4% to 21.6% and then flattens, leaving gross spend to carry growth from FY-2027 on. The bulk of the incremental spend brokers fund is CTV, and margins are held flat, so these models describe a volume-and-mix story rather than an operating-leverage one.
Take rate carried FY-2026; from here the models need gross spend to do the work
Median take rate steps from 20.4% in FY-2025 to 21.6% in FY-2026, then settles back at 21.4% in FY-2027 and 21.5% in FY-2028. So the FY-2026 revenue step-up is modeled as pricing, and from FY-2027 the revenue line depends almost entirely on the spend base beneath it.
| Line | FY-2025A | FY-2026E | FY-2027E | FY-2028E | YoY | Brokers |
|---|---|---|---|---|---|---|
| Spend base | — | — | — | — | — | — |
| Gross spend | $14.14bn | $14.90bn | $16.59bn | $17.84bn | +5.4% | 22 |
| Pricing | — | — | — | — | — | — |
| Take rate(%) | 20.5% | 21.4% | 21.1% | 21.3% | +0.9pt | 24 |
| Revenue | — | — | — | — | — | — |
| Revenue | $2.89bn | $3.18bn | $3.48bn | $3.74bn | +10.0% | 31 |
CTV supplies the growth; mobile in-app and web spend is modeled to go backwards
| Line | FY-2025A | FY-2026E | FY-2027E | FY-2028E | YoY | Brokers |
|---|---|---|---|---|---|---|
| Gross spend - Visual and TV | $6.95bn | $7.67bn | $8.74bn | $9.77bn | +10.4% | 15 |
| Gross spend - Mobile In- App & Web | $4.84bn | $4.37bn | $4.57bn | $4.66bn | -9.7% | 14 |
| Gross spend - Display, Social, Native and others | $1.54bn | $1.69bn | $1.70bn | $1.96bn | +9.6% | 15 |
| Gross spend - Audio | $728.67m | $877.26m | $1.01bn | $1.21bn | +20.4% | 14 |
The live debates: the FY-2027 take rate, and whether mobile spend ever stabilises
Under a point separates the take-rate quartiles for FY-2027, but that point applies to a gross spend base several times larger than revenue, so it is the most valuable disagreement in the set. Mobile in-app and web is the widest of the channel disputes — brokers do not agree whether it stabilises or keeps shrinking.
| Line | Period | Median | Q1–Q3 | Min–max | Brokers |
|---|---|---|---|---|---|
| Take rate(%) | FY-2027E | 21.4% | 20.8%–21.6% | 18.8%–22.6% | 24 |
| Gross spend - Mobile In- App & Web | FY-2028E | $4.67bn | $4.54bn–$5.02bn | $3.33bn–$5.93bn | 10 |
| Gross spend - Visual and TV | FY-2028E | $9.58bn | $9.17bn–$10.40bn | $8.12bn–$11.58bn | 12 |
| Gross spend | FY-2028E | $17.80bn | $17.32bn–$18.42bn | $16.33bn–$20.24bn | 16 |
| Free cash flow | FY-2028E | $937.06m | $876.09m–$1.07bn | $394.24m–$1.55bn | 18 |
Revenue compounds but margins do not: adjusted EBITDA margin holds near 40% to FY-2028
On the operating (adjusted) basis, EBITDA margin stays in a roughly 40% band across all four years even as revenue compounds. FCF margin runs below FY-2025 in the outer years, and diluted share count is roughly flat from FY-2026, so per-share cash flow improves on the dollar cash flow rather than on shrinkage of the share base.
| Line | FY-2025A | FY-2026E | FY-2027E | FY-2028E | YoY | Brokers |
|---|---|---|---|---|---|---|
| Margin | — | — | — | — | — | — |
| EBITDA margin(%) | 40.6% | 39.7% | 40.0% | 40.4% | -0.9pt | 31 |
| FCF margin(%) | 27.1% | 24.6% | 25.4% | 26.0% | -2.5pt | 27 |
| Income from operations - Operating | $1.06bn | $1.13bn | $1.24bn | $1.35bn | +6.0% | 29 |
| Cash and shares | — | — | — | — | — | — |
| Free cash flow | $783.03m | $782.44m | $883.85m | $978.25m | -0.1% | 27 |
| Free cash flow per share($) | $1.58 | $1.64 | $1.85 | $2.05 | +4.1% | 27 |
| Shares - Diluted(M#) | 496.13m Number | 477.24m Number | 478.99m Number | 477.08m Number | -3.8% | 28 |
The KPI tail is thin: retention and client counts rest on one to four brokers
Customer retention rate carries a single broker, and its FY-2027 value was last revised in 2022 — that is one desk's standing assumption, not consensus. Total client count rests on four brokers at FY-2027, and the US/International revenue split on two. The geographic gross spend split carries four to six.
Headline P&L consensus, momentum and beat/miss live in the CapIQ tab.
Source: S&P Capital IQ transcripts via Xpressfeed · latest indexed call 2026-05-07 · generated 2026-07-25.
Latest call digest
The Trade Desk, Inc., Q1 2026 Earnings Call, May 07, 2026 · 2026-05-07T21:00:00
Q1 2026 call — May 07, 2026. Jeff Green and Interim CFO Tahnil Davis reported Q1 revenue of $689 million, up 12% year-over-year, with $206 million of adjusted EBITDA at a 30% margin. Guidance: Q2 revenue of at least $750 million, Q2 adjusted EBITDA of approximately $260 million, and full year 2026 adjusted EBITDA margin of at least 40%, described as approximately in line with 2025.
Prepared remarks were almost entirely forward-looking and thematic. Green organized them around three topics — the macro environment, the state of the global advertising market, and platform innovation — and opened by acknowledging that "the macro environment has certainly become more complex in 2026." His central argument was that 2025 added more ad supply than any prior year, creating what he called the biggest buyers' market in advertising history, which raises the value of objective decisioning by a DSP that owns no media. He spent unusual time on broken measurement and last-touch attribution, on retail data (retailers in the data marketplace representing more than 80% of sales from top U.S. retailers, versus Amazon at less than 15% of U.S. retail spend), on the new Audience Unlimited product, and on agentic AI via a first partnership with Stagwell. Commercial proof points cited: March was the biggest month on record for JBP signings with 45 signed in March alone, total Q1 JBP count up 55% year-over-year, and new JBP deal spend excluding renewals up 40% year-over-year. Davis flagged continued pressure in Home & Garden and Food & Drink as CPG brands navigate geopolitical uncertainty and input cost inflation, and noted automotive would be growing faster absent tariffs.
Q&A went somewhere else. Two topics that received no mention in prepared remarks opened the call: the Publicis negotiations and the departure of Chief Strategy Officer Samantha Jacobson to OpenAI, reported by Adweek hours before the print. Four of the nine questions pressed directly on the implied deceleration in the Q2 outlook or on the path back to growth. Green declined to elaborate on Publicis ("It's probably not prudent for me to say more about it in this forum.") and could not comment on whether record March JBP signings related to the agency dispute. On deceleration he pointed to macro and to the Fortune 500 concentration of his client base rather than to anything company-specific, and separated "cyclical" from "structural" without dating a reacceleration. Justin Patterson's question on how a 40% full-year margin is reached from a 30% Q1 drew a restatement of the target plus general discipline commitments — headcount growth below revenue growth, deliberate investment prioritization — rather than named levers. Green framed 2026 four separate times as "a year of disciplined reinvestment."
What was actually committed: the Q2 revenue floor, the Q2 EBITDA estimate, and the full-year margin floor. Nothing else in the call carried a number attached to a future period.
Participant coverage from the latest call.
| Group | Participants | Count |
|---|---|---|
| Management | Operator; Chris Toth — Vice President of Investor Relations, The Trade Desk, Inc.; Jeffrey Green — Co-Founder, CEO, President & Chairman, The Trade Desk, Inc.; Tahnil Davis — Chief Accounting Officer & Executive VP, The Trade Desk, Inc. | 4 |
| Analysts | Shyam Patil — Senior Analyst, Susquehanna Financial Group, LLLP, Research Division; Vasily Karasyov — Founder, Cannonball Research, LLC; Matthew Swanson — Analyst, RBC Capital Markets, Research Division; Justin Patterson — MD & Equity Research Analyst, KeyBanc Capital Markets Inc., Research Division; Mark Zgutowicz — Senior Equity Analyst, The Benchmark Company, LLC, Research Division; Youssef Squali — Head of Internet, Truist Securities, Inc., Research Division; Timothy Nollen — Research Analyst, SSR LLC; Jessica Reif Cohen — Managing Director in Equity Research, BofA Securities, Research Division; Jason Helfstein — MD & Senior Internet Analyst, Oppenheimer & Co. Inc., Research Division | 9 |
Curated latest-call exchanges; one row per analyst topic.
| Analyst | Firm | Topic | What changed in Q&A |
|---|---|---|---|
| Shyam Patil | Susquehanna Financial Group, LLLP, Research Division | Publicis negotiations and the Q2 deceleration | Two-part opener. Green called the reported conflict overdramatized, noted billions of dollars of business with Publicis since 2018 and that negotiations are ongoing, then declined further comment in that forum. On Q2 he attributed the slowdown to macro conditions and to the fact that most revenue comes from Fortune 500 brands, which respond differently to global headwinds than smaller advertisers. No company-specific driver was named. |
| Vasily Karasyov | Cannonball Research, LLC | Chief Strategy Officer departure to OpenAI | Karasyov noted the Adweek piece ran the same day, before results. Green confirmed Samantha Jacobson is taking a role at OpenAI, said she remains on the Board, and pivoted to describing senior leadership hires the company has been making. The prepared remarks had not mentioned the departure. |
| Matthew Swanson | RBC Capital Markets, Research Division | Cyclical versus secular drivers of reacceleration | Asked which parts of a return to growth are within management's control. Green separated structural from cyclical, said reacceleration "isn't really about reinventing ourselves" but about executing against an expanding opportunity, and said a stabilizing macro would provide a tailwind that is not present now. No timeframe was offered. |
| Justin Patterson | KeyBanc Capital Markets Inc., Research Division | Levers to the 40% full-year EBITDA margin | The sharpest financial question, noting both revenue and margins started the year softer. Davis restated the at-least-40% full-year target and cited headcount growth below revenue growth, cash flow flexibility in pacing investments, and prioritizing highest-ROI areas. Specific levers bridging a 30% Q1 margin to the full-year figure were not itemized. |
| Mark Zgutowicz | The Benchmark Company, LLC, Research Division | Agency-related weakness and CPG/auto comps | Asked whether anything agency-related or one-time sits inside the Q2 guide, framing it as below industry expectations for digital and video growth. Green said there is "not really anything incremental to add on the agency front" and did not address the one-time-item part. He agreed CPG and auto comps ease later in the year but argued the more important point is the discipline those advertisers have adopted. |
| Youssef Squali | Truist Securities, Inc., Research Division | LLMs and AI search as an ad opportunity | Asked for gating factors, P&L impact and where conversations stand with key players. Green declined to discuss the specific discussions, compared the LLMs to Netflix a decade ago given expensive content, argued detailed prompts support richer ad formats than legacy search including video, and closed by saying the opportunity is in the first inning, "a couple of pitches in, max." No revenue timing was given. |
| Timothy Nollen | SSR LLC | Whether to build sell-side services; OpenTTD | Green gave the most categorical answer of the call: the company will never do yield management for publishers, because serving buyers and sellers simultaneously recreates the ad network conflict. He tied OpenPath and OpenTTD to plugging into publishers who run their own yield management, and said it is the hub he referred to in prepared remarks. |
| Jessica Reif Cohen | BofA Securities, Research Division | Timing and impact of agentic trading | Green rejected the framing of being "impacted" by AI and said the company will lead the agentic shift in programmatic. He criticized competitors' agentic approaches as recreating ad networks one advertiser-to-publisher connection at a time, and described the Stagwell work as starting with campaign creation and editing before moving to optimization. No adoption timeline or revenue contribution was given. |
| Jason Helfstein | Oppenheimer & Co. Inc., Research Division | Agentic economics; whether record JBPs relate to the agency dispute | Final question of the call. Green said the agentic problem is optimization rather than commercial terms. On the yes/no follow-up, he said he could not comment on whether the record March JBP signings relate to the agency discussions — leaving the most direct read-through on the Publicis situation unanswered. |
Theme tracker
Themes are curator-classified across supplied calls.
| Theme | Status | Quarters mentioned | Read-through |
|---|---|---|---|
| CTV shift toward biddable, decisioned buying | persisted | Q2 2023, Q3 2023, Q4 2023, Q1 2024, Q2 2024, Q3 2024, Q4 2024, Q1 2025, Q2 2025, Q3 2025, Q4 2025, Q1 2026 | The single constant across every call in the index. The argument has not changed — premium content owners eventually move from insertion orders and programmatic guaranteed to biddable — but the emphasis has shifted from persuading publishers to open up (2023-2024, when Laura Martin pushed back that Disney, Paramount and Fox disagreed) to describing it as already underway. Analyst questions on CTV have thinned considerably since 2024, which reads as the debate being settled rather than the topic being dropped. |
| Amazon and DSP competitive intensity | persisted | Q4 2023, Q1 2024, Q2 2024, Q3 2024, Q4 2024, Q1 2025, Q2 2025, Q3 2025, Q4 2025 | Raised by analysts on nine consecutive calls from Q4 2023, peaking in Q1 and Q2 2025. Management's answer has been stable — Amazon prioritizes owned-and-operated inventory and cannot credibly claim objectivity — with Green adding in Q4 2025 that Google was a better competitor than Amazon is or likely will be. Notably, no analyst asked about Amazon on the Q1 2026 call; the question budget went to guidance and management turnover instead. |
| Agentic AI | emerged | Q2 2025, Q3 2025, Q4 2025, Q1 2026 | Absent from the transcripts before Q2 2025, then the fastest-rising topic in the set. By Q4 2025 Green was arguing complexity is a moat that agentic AI enhances rather than disintermediates; by Q1 2026 it had a named commercial anchor in the Stagwell partnership and drew three of nine analyst questions. It has become the principal forward-looking story, which is worth noting because it is also the least quantified one. |
| CPG and automotive vertical weakness | emerged | Q2 2025, Q3 2025, Q4 2025, Q1 2026 | Green said on the Q4 2025 call that CPG and auto companies began navigating category headwinds beginning in Q2 2025, that together the two verticals represent over a quarter of the business, and that the company would have been at least 5% higher in growth rate excluding them. Q1 2026 continued the theme through Home & Garden and Food & Drink softness and a tariff drag on autos. This is the most concrete, quantified explanation management has given for the growth step-down. |
| Organizational change and senior leadership turnover | persisted | Q4 2024, Q1 2025, Q2 2025, Q3 2025, Q4 2025, Q1 2026 | Began with the Q4 2024 recalibration after the first guidance miss, and has appeared on every call since. The CFO seat alone has had three voices in four calls — Laura Schenkein through Q2 2025, Alex Kayyal presenting as CFO in Q3 2025, and Tahnil Davis as Interim CFO in Q4 2025 and Q1 2026 — and Q1 2026 added the Chief Strategy Officer's departure. Analysts have asked about it on four of the last six calls. |
| Measurement and attribution reform | persisted | Q2 2023, Q3 2023, Q4 2023, Q1 2024, Q2 2024, Q3 2024, Q4 2024, Q1 2025, Q2 2025, Q3 2025, Q4 2025, Q1 2026 | Present throughout, but its weight changed sharply. In Q4 2025 it was framed as a coming framework; in Q1 2026 it became a structural centerpiece of the prepared remarks, with Green saying he has "never seen more discussion in the history of our space" about how broken last-touch attribution is. The escalation is worth watching: it positions an industry-wide fix, not a Trade Desk product, as the unlock for the next phase of growth. |
| Cookie deprecation, Privacy Sandbox and UID2 | dropped | Q2 2023, Q3 2023, Q4 2023, Q1 2024, Q2 2024 | Dominated 2023 and the first half of 2024 — the Q4 2023 call alone was built substantially around it, with three separate analyst questions on cookie deprecation, Privacy Sandbox and advertiser readiness. It disappears from Q3 2024 onward and no analyst has raised it since. UID2 followed a slower version of the same arc, from a headline identity strategy in 2023 to no mention at all on the Q1 2026 call, though it still surfaces operationally as the pipe most retail data partners use. |
| Kokai platform migration | dropped | Q2 2023, Q3 2023, Q4 2023, Q1 2024, Q2 2024, Q3 2024, Q4 2024, Q1 2025, Q2 2025, Q3 2025, Q4 2025 | Present on all eleven prior calls in the index and the dominant product story through 2025 — the Q2 2025 call carried a commitment that all clients would be on it by year-end, and Q4 2025 reported almost 100% of clients running through it. The Q1 2026 call does not mention Kokai once. Read most naturally as the migration being finished and the narrative rotating to Audience Unlimited and agentic AI, but it does mean the platform that carried the growth story for two years has no update in the latest quarter. |
| Google antitrust proceedings as a catalyst | dropped | Q2 2024, Q3 2024, Q4 2024, Q1 2025, Q3 2025 | A recurring analyst question from Q2 2024 through Q3 2025, when Youssef Squali asked about closing arguments due that November. It does not appear on the Q4 2025 or Q1 2026 calls in any form. The catalyst that was repeatedly framed as a potential share-shift tailwind has simply stopped being discussed, without a stated resolution either way in the call history. |
Guidance ledger
Quotes, calls, and speakers are source-verified; outcomes are curator-classified.
| Verbatim guidance | Call | Speaker | Curator outcome | Outcome note |
|---|---|---|---|---|
| “For Q2, we expect revenue to be at least $750 million.” | The Trade Desk, Inc., Q1 2026 Earnings Call, May 07, 2026 · 2026-05-07T21:00:00 | Tahnil Davis | pending | Guided on the most recent call; the reporting quarter has not been covered by any call in the supplied history. |
| “Taken together, we continue to expect our full year 2026 adjusted EBITDA margin percentage to be at least 40%, approximately in line with 2025.” | The Trade Desk, Inc., Q1 2026 Earnings Call, May 07, 2026 · 2026-05-07T21:00:00 | Tahnil Davis | pending | Full-year 2026 commitment. Q1 2026 adjusted EBITDA was $206 million on $689 million of revenue, a 30% margin, so the target implies materially higher margins across the balance of the year. |
| “For the first quarter, we expect revenue to be at least $678 million, representing 10% year-over-year growth.” | The Trade Desk, Inc., Q4 2025 Earnings Call, Feb 25, 2026 · 2026-02-25T22:00:00 | Tahnil Davis | kept | Q1 2026 revenue was reported at $689 million on the May 07, 2026 call, above the floor. |
| “We estimate adjusted EBITDA for Q1 to be approximately $195 million.” | The Trade Desk, Inc., Q4 2025 Earnings Call, Feb 25, 2026 · 2026-02-25T22:00:00 | Tahnil Davis | kept | Q1 2026 adjusted EBITDA was reported at $206 million, above the estimate. |
| “For Q4, we expect revenue to be at least $840 million.” | The Trade Desk, Inc., Q3 2025 Earnings Call, Nov 06, 2025 · 2025-11-06T22:00:00 | Alex Kayyal | kept | Q4 2025 revenue was reported at $847 million on the Feb 25, 2026 call. |
| “We estimate adjusted EBITDA for Q4 to be approximately $375 million.” | The Trade Desk, Inc., Q3 2025 Earnings Call, Nov 06, 2025 · 2025-11-06T22:00:00 | Alex Kayyal | kept | Q4 2025 adjusted EBITDA was reported at approximately $400 million, above the estimate. |
| “we expect Q3 revenue to be at least $717 million, reflecting 14% year-over-year growth” | The Trade Desk, Inc., Q2 2025 Earnings Call, Aug 07, 2025 · 2025-08-07T21:00:00 | Laura Schenkein | kept | Q3 2025 revenue was reported at $739 million on the Nov 06, 2025 call. The guide was issued with an explicit macro-stability condition attached. |
| “in Q2, we expect revenue to be at least $682 million, reflecting 17% year-over-year growth” | The Trade Desk, Inc., Q1 2025 Earnings Call, May 08, 2025 · 2025-05-08T21:00:00 | Laura Schenkein | kept | Q2 2025 revenue was reported at $694 million on the Aug 07, 2025 call. |
| “We expect revenue to be at least $575 million, reflecting 17% year-over-year growth.” | The Trade Desk, Inc., Q4 2024 Earnings Call, Feb 12, 2025 · 2025-02-12T22:00:00 | Laura Schenkein | kept | Q1 2025 revenue was reported at $616 million on the May 08, 2025 call, comfortably above the floor set immediately after the Q4 2024 miss. |
| “We estimate Q4 revenue to be at least $756 million, which would represent growth of about 25% on a year-over-year basis.” | The Trade Desk, Inc., Q3 2024 Earnings Call, Nov 07, 2024 · 2024-11-07T22:00:00 | Laura Schenkein | missed | Q4 2024 revenue came in at $741 million, below the floor. Management addressed it directly on the Feb 12, 2025 call, calling it the first shortfall in 33 quarters as a public company and taking full ownership. |
| “We estimate adjusted EBITDA to be approximately $363 million in Q4.” | The Trade Desk, Inc., Q3 2024 Earnings Call, Nov 07, 2024 · 2024-11-07T22:00:00 | Laura Schenkein | missed | Q4 2024 adjusted EBITDA was $350 million, below the estimate, alongside the revenue shortfall. |
| “We estimate Q3 revenue to be at least $618 million, which would represent growth of 25% on a year-over-year basis.” | The Trade Desk, Inc., Q2 2024 Earnings Call, Aug 08, 2024 · 2024-08-08T21:00:00 | Laura Schenkein | kept | Q3 2024 revenue was reported at $628 million on the Nov 07, 2024 call. |
Q&A pressure map
Question counts and firms are curator tallies; analyst coverage shown above.
| Topic | Questions | Firms | Pressure / response |
|---|---|---|---|
| Deceleration, guidance and the path back to growth | 13 | Susquehanna Financial Group, LLLP, Research Division, Cannonball Research, LLC, KeyBanc Capital Markets Inc., Research Division, Evercore ISI Institutional Equities, Research Division, Oppenheimer & Co. Inc., Research Division, RBC Capital Markets, Research Division, The Benchmark Company, LLC, Research Division | The heaviest and most persistent line of questioning across the last eight calls, clustered in Q4 2024 (five questions after the first guidance miss) and Q1 2026 (four). Analysts have repeatedly asked the same thing in different words: what specifically drives reacceleration and when. Management's answers have been consistent in structure — structural drivers are intact, macro is the constraint, execution is the near-term job — and consistently without a date or a quantified bridge. Mark Mahaney had to repeat his Q4 2024 question verbatim to get the reacceleration factors addressed. |
| Amazon, DV360 and DSP competitive intensity | 11 | Truist Securities, Inc., Research Division, Cannonball Research, LLC, Wolfe Research, LLC, Oppenheimer & Co. Inc., Research Division, RBC Capital Markets, Research Division, Stifel, Nicolaus & Company, Incorporated, Research Division, Susquehanna Financial Group, LLLP, Research Division, KeyBanc Capital Markets Inc., Research Division | Sustained from Q2 2024 through Q4 2025 and answered the same way each time: competitors sell their own inventory, so they cannot be objective. Shyam Patil's Q3 2025 question sharpened the point — won't Amazon simply price to zero to take share — and the answer addressed structural conflict rather than pricing. The absence of any Amazon question on the Q1 2026 call is itself notable. |
| AI and agentic economics | 8 | KeyBanc Capital Markets Inc., Research Division, Oppenheimer & Co. Inc., Research Division, Truist Securities, Inc., Research Division, BofA Securities, Research Division | Rising fast since Q2 2025. Analysts have moved from asking what the company is building to asking about monetization, competitive scale versus Amazon and Google's parent-company AI resources, and timing. Youssef Squali asked twice — Q4 2025 on how agentic changes the monetization model, Q1 2026 on gating factors and P&L impact — and neither answer put a number or a period on it. Green's Q1 2026 framing of the LLM opportunity as a couple of pitches into the first inning is the closest thing to a timing statement in the set. |
| Organizational change and leadership turnover | 6 | Susquehanna Financial Group, LLLP, Research Division, KeyBanc Capital Markets Inc., Research Division, Cannonball Research, LLC, Evercore ISI Institutional Equities, Research Division | Recurring since Q4 2024. Vasily Karasyov has effectively kept a running audit, asking in Q4 2025 what the reorganization from a year earlier had actually achieved, and in Q1 2026 for the details behind the Chief Strategy Officer's exit to OpenAI. Answers have described process changes — clearer ownership, unified go-to-market coverage, JBP pipeline growth — rather than operating metrics tied to those changes. |
| OpenPath, supply path and platform neutrality | 6 | BofA Securities, Research Division, SSR LLC, Wells Fargo Securities, LLC, Research Division | A quieter but recurring pressure point that has changed character. Through Q1 2025 the questions were about scaling and publisher adoption; by Q4 2025 Alec Brondolo asked directly whether press reports of transparency and conflict-of-interest concerns mean OpenPath lacks product-market fit, and Tim Nollen asked in Q1 2026 whether the company should build sell-side services at all. Both answers were direct and specific, including the 4.5% OpenPath fee and a flat commitment never to do yield management for publishers. |
| Kokai adoption and measurable ROI | 6 | RBC Capital Markets, Research Division, Cannonball Research, LLC, KeyBanc Capital Markets Inc., Research Division, Evercore ISI Institutional Equities, Research Division | Concentrated in Q2 2025, when Mark Mahaney pushed on whether the cited 20-point KPI improvement compounds over time or is a one-step gain. The line of questioning has since gone quiet as adoption completed, and no analyst asked about Kokai on the Q1 2026 call. |
| CPG, auto and tariff exposure | 5 | Susquehanna Financial Group, LLLP, Research Division, Oppenheimer & Co. Inc., Research Division, The Benchmark Company, LLC, Research Division, Cannonball Research, LLC, Evercore ISI Institutional Equities, Research Division | Emerged with the tariff environment in Q2 2025 and became a direct challenge by Q4 2025, when Jason Helfstein asked what has to happen to accelerate growth if CPG and auto stay weak. Management has answered this cluster with more specificity than most — vertical share of business, the estimated growth drag, named advertisers on both sides of the divide — which stands out against the more abstract answers elsewhere. |
| The Publicis relationship and agency dynamics | 3 | Susquehanna Financial Group, LLLP, Research Division, The Benchmark Company, LLC, Research Division, Oppenheimer & Co. Inc., Research Division | New on the Q1 2026 call and the clearest instance of questions not being answered. Green declined to go beyond confirming ongoing negotiations, told Mark Zgutowicz there was nothing incremental to add on the agency front without addressing the one-time-items part of that question, and told Jason Helfstein he could not comment on whether record March JBP signings relate to the agency discussions. These are explicit declines rather than deflections, but three separate analysts left the call without the read-through they asked for. |
Language shifts
Only language evidence verified against the referenced component is shown.
| Observation | Verbatim evidence | Call ID | Component |
|---|---|---|---|
| The Q1 2026 call opens with an explicit acknowledgment that conditions have worsened rather than the growth-and-share framing that opened every 2024 call. Green has moved from describing macro as a backdrop to naming it as a complicating force in the current year. | “The macro environment has certainly become more complex in 2026.” | 1996530678 | 2 |
| "Geopolitical uncertainty" is new CFO vocabulary. The Q1 2026 financial remarks lead with challenges before results, where the equivalent Q2 2024 remarks led with strong performance and closed with a statement of being extremely pleased. | “The start of 2026 has brought unique challenges, including geopolitical uncertainty that our clients are currently navigating.” | 1996530678 | 3 |
| "A year of disciplined reinvestment" entered the vocabulary on the Q4 2025 call and was repeated four times across the Q1 2026 call by both Green and Davis. It functions as the explanation for margin pressure and, implicitly, for why growth is not the near-term measure of success. | “it's important to think about 2026 as a year of disciplined reinvestment” | 1980876042 | 7 |
| Confidence language has shifted from results to forward conviction. On the Q4 2025 call Green paired an unusually blunt self-assessment of the print with an assertion of undiminished optimism — a construction that had no precedent in the 2023 and 2024 calls in this set. | “Despite the fact that I don't think that this is our best earnings report ever, I hope you can hear it that I am as optimistic as ever” | 1980876042 | 10 |
| The Q4 2025 harvest metaphor is a hedge on timing: the organizational upgrades are asserted to be right, while the returns are placed in the future. Green paired "green shoots" with "we have not harvested most of those seeds" in the same sentence. | “Even though we have not harvested most of those seeds, we are seeing green shoots and are extremely confident that we've made the right moves to scale and improve this business.” | 1980876042 | 2 |
| Conditional guidance language appeared in 2025 and has since disappeared. Q1 2025 and Q2 2025 guides were both issued subject to macro stability; the Q4 2025 and Q1 2026 guides carry no such conditional clause, even as macro commentary in the surrounding remarks grew more cautious. | “Assuming the macro environment remains stable and we don't see disruptions from large global brands, which make up a significant portion of our business due to tariff uncertainty, we expect Q3 revenue to be at least $717 million” | 1954388562 | 3 |
| The earlier caution vocabulary was narrower and quarter-specific. In Q3 2024 the qualifier was a single phrase attached to the next quarter; the 2026 equivalents are structural statements about the operating environment. | “we are cautiously optimistic for Q4.” | 1901030220 | 3 |
| Accountability language entered the vocabulary with the Q4 2024 miss and has stayed. Green's ownership statement there is the origin point for the recalibration, reorganization and reinvestment framing that runs through every subsequent call. | “for the first time in 33 quarters as a public company, we fell short of our own expectations” | 1928886322 | 2 |
| By Q1 2026 that accountability language has become forward-looking and conditional on execution rather than retrospective — an unusual construction for a company whose prepared remarks otherwise argue its position has never been stronger. | “We recognize that at this moment, where the macro is more uncertain and we are evolving parts of our business require clarity, accountability and strong execution.” | 1996530678 | 2 |
The call history is unusually consistent on strategy and unusually thin on timing. Management has told the same story about objectivity, CTV and the open internet for twelve straight quarters while reported growth stepped down from 25% in Q1 2025 to 12% in Q1 2026, and the guidance record since the Q4 2024 miss has been clean — every subsequent revenue and EBITDA guide in this history was met. What the transcripts do not contain is a dated, quantified path back to faster growth: each time analysts have asked, the answer has been macro plus execution. The debate the calls sharpen is therefore not whether the thesis holds but whether 2026's disciplined reinvestment, agentic AI and measurement reform are the mechanism of reacceleration or the vocabulary that accompanies its absence.
Competitors describe The Trade Desk, Inc.'s market in their own filings and calls. These verified passages and visual pages show where their strategies meet, using source documents preserved in Sources.
Amazon.com, Inc. (Amazon Ads / Amazon DSP) (AMZN)
Amazon runs the demand-side platform most often named as the direct threat to The Trade Desk's core business, and it is buying its way into exactly the inventory TTD depends on — Roku, Netflix, Disney, Spotify, SiriusXM. Only the advertising discussion is used here; AWS, Stores, devices and Project Kuiper/LEO are outside the comparison. Amazon does not disclose DSP revenue separately, so the exhibits are management's qualitative claims plus the total-ads line they sit inside.
Amazon's own framing of the Amazon DSP push, from the Q2 2025 call. The commercially material word is “exclusively”: Amazon states that access to Roku's 80 million connected-TV households runs through its own DSP, and pairs it with a direct integration to Disney's ad exchange. Both are supply arrangements in the channel that drives most of The Trade Desk's growth; the “80 million” figure is Amazon's own claim about authenticated CTV households, not an audited market measure, and the $15.7bn is total Amazon Ads revenue across retail, Prime Video, Twitch and third-party inventory — not DSP revenue, which Amazon does not break out.
Andrew Jassy (President and Chief Executive Officer): Moving on to Amazon ads. We're pleased with the strong growth, generating $15.7 billion of revenue in the quarter, growing 22% year-over-year. […] Another area we're excited about is our demand-side platform, or Amazon DSP. Our DSP enables advertisers to plan, activate, and measure full-funnel investments. Our trillions of proprietary browsing, shopping, and streaming signals, paired with extensive supply-side relationships and our secure clean rooms, provide advertisers the ability to optimize advertising, deliver greater precision, and drive efficient and effective advertising outcomes. And in June, we announced a momentous partnership with Roku, giving advertisers access to 80 million connected TV households—the largest authenticated connected TV footprint in the U.S.—exclusively through Amazon DSP. […] We also announced an integration between Disney's real-time ad exchange and Amazon DSP. This collaboration allows advertisers to gain direct access to Disney's premium inventory across platforms like Disney+, ESPN, and Hulu while allowing them to leverage insights from both companies.
p. 2 · Read in context →
Answering an analyst who asked management to disaggregate advertising growth between the core business, DSP and Prime Video, Amazon's CEO describes the DSP as having spent 20 months closing feature gaps and now being “fully featured.” That is a statement about historical weakness as much as current strength — the gap-closing is the argument for why Amazon can now compete for the enterprise programmatic budgets that independent DSPs have held. No revenue figure is attached to the DSP claim, and “largest connected TV presence in the U.S.” is Amazon's characterisation of its Roku partnership. The parser's “platform i expanding” is an OCR artefact of the source page, preserved as indexed.
Andrew Jassy (President and Chief Executive Officer): Our demand-side platform, Amazon DSP, is also growing rapidly. We have addressed customer feedback over the past 20 months and closed key gaps, making our DSP fully featured. Our partnership with Roku provides the largest connected TV presence in the U.S. Furthermore, we have added integration opportunities with ad inventory from Netflix, Spotify, and SiriusXM for our DSP customers. This combination is powerful, and our demand-side platform i expanding quickly, giving us a positive outlook on our progress while noting that we still have work to do. However, we are far from reaching our growth potential there.
p. 10 · Read in context →
The most recent quarter in the file. Two things to separate: the $17.2bn is all of Amazon Ads growing 22%, and the “leader in omnichannel advertising platforms” line is Amazon citing a third-party analyst report (Forrester) rather than a share statistic. What is new versus the prior exhibits is the data direction of travel — Amazon Audiences applies Amazon's shopping and streaming signals to Netflix inventory, extending the retail data advantage onto premium third-party CTV supply rather than only Amazon-owned screens.
Andrew R. Jassy (Chief Executive Officer): Moving on to Amazon Ads. We continue working to be the best place for brands of all sizes to grow their businesses, and we are pleased with the continued strong growth across our full-funnel offerings, generating $17.2 billion of revenue in the quarter and up 22% year over year. Forrester recently recognized Amazon as a leader in omnichannel advertising platforms, with unmatched supply and insights for connected TV and commerce media. We deepened our Netflix partnership with Amazon Audiences, which enables advertisers to apply Amazon’s exclusive signals from shopping, browsing, and streaming to Netflix’s highly engaged viewers to reach the right audiences and drive even stronger performance. We also partner with Comcast to expand local advertising to thousands of brands, and expanded interactive video ad capabilities to partners starting with Samsung TVs.
p. 4 · Read in context →
Viant Technology Inc. (DSP)
The closest thing in the peer set to a like-for-like comparison: a buy-side-only, independent DSP with a CTV-led mix, selling against the same walled gardens. Viant's 10-K names The Trade Desk as a competitor, and on its calls management repeatedly benchmarks itself against TTD by name — on growth rate, on account wins, and on whether TTD is still “independent” after OpenPath. It is roughly a fiftieth of TTD's size, so the exhibits are worth reading as positioning by a challenger, not as evidence of share shift.
Asked by an analyst how the competitive environment evolves as Google and Amazon build out their DSPs, Viant's CEO turns the question onto The Trade Desk. The specific charge is that OpenPath and supply-path monetisation move TTD into sell-side territory and therefore out of the “objective buy-side only” category. Read against the Q1 FY2026 exhibit above — recorded two quarters later, where Viant puts TTD back inside that category — the framing is inconsistent, which is itself a reason to treat it as competitive positioning rather than analysis. “wit some” is an OCR artefact in the indexed page.
Tim Vanderhook (Co-Founder & Chief Executive Officer): I mean, I view the competitive space as getting smaller and smaller. Trade Desk has made specific moves around OpenPath and charging for what used to be SSP territory. So we made in our prepared comments Google wants to sell you YouTube. Amazon wants to sell you Prime Video. And Trade Desk wants to redirect your spends through OpenPath, their own SSP where they are making incremental margins. Viant takes a different approach from that, and so we see less competition. You look at truly objective buy-side only platforms. Historically, there was The Trade Desk and ourselves. I think wit some of The Trade Desk's recent moves, that puts them more in the, I guess, no longer independent or objective when it comes to the pathways.
p. 9 · Read in context →
Alphabet Inc. (Google advertising — YouTube, Google Network, DV360) (GOOGL)
Google is both the largest buyer-side platform competitor (Display & Video 360, Google Marketing Platform) and the owner of the CTV property that competes hardest for the budgets TTD sells against. Only the advertising discussion is used — Cloud, TPUs, Gemini infrastructure, Waymo and Other Bets are excluded. The Google Network line is the most directly comparable disclosure in the peer set: it is Google's own revenue from third-party, non-owned inventory, the same open-web pool TTD monetises.
The single most useful line Google publishes for sizing the open internet. “Network” is Google's revenue from advertising served on third-party publisher properties rather than its own — structurally the same pool The Trade Desk buys in — and it is shrinking (down 4% here; down 2% to $7.8bn in the Q4 FY2025 call, down 1% in Q2 FY2026) while Google's owned YouTube inventory grows double digits. Google gives no reason for the decline on this page, and the trend does not distinguish between budget leaving the open web and budget leaving Google's share of it.
Philipp Schindler (President & Chief Business Officer): Google Services revenues were $90 billion for the quarter, up 16% year-on-year, primarily driven by the continued growth of Search, adding some further color to our results. Certain Other delivered 19% growth, primarily driven by retail and finance. YouTube advertising revenues grew 11%, driven by direct response followed by brand. Network advertising revenues were down 4% year-on-year.
p. 3 · Read in context →
Google's stated position in the living room, the channel that carries most of The Trade Desk's growth. The “three consecutive years” streaming watch-time claim is attributed to Nielsen on the prior quarter’s call (Q4 FY2025, p4) and carries no source on this page; it measures viewing time, not advertising share, and YouTube's inventory is largely unavailable through independent DSPs. The second fragment is the collision point in miniature — curated premium supply, packaged by genre and sold with cross-format CTV measurement, is the product independent platforms sell too.
Philipp Schindler (President & Chief Business Officer): Turning to YouTube, which now has led streaming watch time in the U.S. for three consecutive years. We're in an unmatched position to connect brands with the audiences they care about in the moment they engage. […] We've also made it easier to buy premium ad space in top-tier podcast shows by curating the most watched podcasts into popular genres. For example, Super Group partnered with YouTube creator Liza Koshy on a multi-format Shorts and long-form CTV campaign, resulting in a 93% lift for their Glowscreen product and a 55% overall brand lift. […] Brands are benefiting from growth in the living room where we continue to scale greater brand deals.
p. 4 · Read in context →
Nexxen International Ltd. (NEXN)
Nexxen sits on both sides of The Trade Desk: it runs its own enterprise DSP that competes for the same advertiser budgets, and it is simultaneously a supplier — licensing smart-TV ACR data to TTD and routing smart-TV home-screen inventory into TTD's Ventura ecosystem. That dual position makes its disclosures unusually informative about how supply-path optimisation and CTV pricing are landing on the sell side. Nexxen's transcripts in this file are web-page captures with cookie-banner text interleaved by the parser; quotes are drawn from clean paragraphs only.
A guidance cut attributed in part to a large DSP customer pushing supply-path optimisation. Nexxen does not name the customer here or elsewhere on the call — it describes only “our leading DSP customer” — so the identification should not be assumed, though Nexxen names The Trade Desk as one of its major DSP partners on the following quarter's call. The second fragment is the strategic response and the reason Nexxen belongs in a competitive set at all: build up its own DSP and data platform to “reduce third-party reliance.”
Ofer Druker (Chief Executive Officer): While we are encouraged by our momentum and strategic progress, we are disappointed to lower guidance due to near-term headwinds, including softness in select channels and a shift in our leading DSP customer reinforcing its SPO strategy. […] Our strategy is evolving, not changing, as we are doubling down on our DSP, discovery, and broader data platform to drive enterprise adoption, strengthen end-to-end revenue opportunities, and reduce third-party reliance.
p. 10 · Read in context →
Nexxen defining a new CTV inventory pool — the smart-TV home screen — and naming The Trade Desk as the first DSP to plug into it (the sentence continues onto the next page: “following an agreement between V, The Trade Desk, and Nexxen International Ltd. to bring this inventory into The Trade Desk Ventura ecosystem”). This is the partnership face of the relationship, and it cuts in TTD's favour: exclusive-feeling access to a surface Nexxen says was previously sold only through direct deals. The ten-minutes-per-day figure is Nexxen's citation of Nielsen; no inventory volume or pricing is given.
Ofer Druker (Chief Executive Officer): scaled programmatic access to home screen inventory on CTV OEMs. I would like to provide some background, as this type of CTV media has not historically been available for programmatic activation. When a user turns on their smart TV, they land on the operating system home screen, which presents them with a menu of apps and content to consume. […] According to Nielsen, viewers spend an average of about ten minutes per day on this screen deciding what to watch, making it a highly visible and valuable surface. Until now, advertising space on this page has been sold and managed through direct deals and ad servers. Our innovations transform this surface into a fully programmatic advertising opportunity. […] Vidaa, which rebranded as V, is a CTV operating system for Hisense and other OEM brands, and is our first OS partner to adopt this technology, which is now integrated across V-powered devices globally. As announced by The Trade Desk last week, we are pleased to welcome them as our first strategic DSP partner to adopt the solution
p. 9 · Read in context →
A sell-side read on CTV pricing. Nexxen reports its own CTV revenue down 17% year over year and lists “more competitive CTV CPMs” among the causes — i.e. falling prices per thousand impressions as streaming supply expands. Falling CPMs are ambiguous for a buy-side platform: cheaper inventory can pull budget in, while platform revenue tied to a percentage of spend moves with the price paid. This is one company's channel mix, not an industry CPM index.
Sagi Niri (Chief Financial Officer): We also observed year-over-year decreases in CTV and display, as well as reduced spending within our government, retail, and education verticals. CTV revenue declined 17% year-over-year in Q3, or 13% ex-political, to $24.5 million. […] Results were impacted by decreased activity from select third-party deals, partners within our ONP and PMP channels, tariff-related spending reductions from certain customers, and more competitive CTV CPMs.
p. 11 · Read in context →
Criteo S.A. (CRTO)
Criteo competes for open-internet performance budgets and is the scaled incumbent in retail/commerce media — the adjacent pool The Trade Desk has been building toward. It is also the first ad-tech company to take demand into ChatGPT, which puts it directly alongside TTD in the emerging AI-surface inventory race. Only the advertising business is relevant; Criteo has no CTV buying platform of comparable scale, which is why it carries two exhibits rather than three.
Criteo's claim to first-mover status on advertising inside ChatGPT, with a stated 1,000+ brands live. The relevance to The Trade Desk is that AI assistants are being contested as a new inventory surface by more than one buy-side platform at once; Criteo's angle is commerce intent rather than open-web reach. No revenue is attached to the ChatGPT integration, and “over $1 trillion in e-commerce transactions” is Criteo's description of data visibility, not spend it monetises.
Michael Komasinski (Chief Executive Officer, Director): This is powered by our unique commerce data foundation with visibility into over $1 trillion in e-commerce transactions annually and reach across billions of daily active users, products, and interactions, allowing us to operate at scale. […] We became OpenAI's first ad tech partner, integrating our demand into ChatGPT's advertising offering with a focus on experiences that are relevant, additive, and built on user trust. This positions us at the forefront of a new high-intent Discovery Channel for our advertiser clients. […] We now have over 1,000 brands live with incremental budgets from both existing and new clients, strong agency traction, and early expansion across international markets.
p. 3 · Read in context →
Criteo's stated position in retail media, the category The Trade Desk has been pushing into through retail data partnerships. The supply claims are specific and checkable in kind — 70% of the top 30 US retailers, 235 retailer clients — and are about exclusive on-site inventory that is not biddable through an independent DSP. The third fragment is where the two businesses meet head-on: “offsite” retail media is retailer data activated against open-web and CTV inventory, which is the same motion TTD sells. The 2000% ROAS figure is a single campaign result reported by Criteo.
Michael Komasinski (Chief Executive Officer, Director): Turning to Retail Media. Retail Media is the fastest growing segment of digital advertising and a growth engine for Criteo. We have a clear leadership position and unmatched supply at scale, including 70% of the top 30 retailers in the US and half of the top 30 retailers in EMEA. […] As a trusted partner to 235 retailers, we see agentic commerce reshaping how consumers discover products, not where commerce happens. […] Offsite, which extends Retail Media beyond retail properties, is becoming more strategic and increasingly always on. One of the world's largest computer brands partnered with us on our largest Commerce Max offsite activation to date this quarter. The campaign reached seven million unique Costco shoppers and delivered more than 2000% ROAS during Cyber Week.
p. 5 · Read in context →
Adobe Inc. (Adobe Advertising) (ADBE)
Adobe operates a full demand-side platform of its own, and the interesting thing is what its filings now say about it. Only the Publishing and Advertising segment and the Adobe Advertising product description are used here — Creative Cloud, Document Cloud and the Digital Experience marketing suite are outside the comparison. Adobe is last in this set because the exhibits document a competitor stepping back from the category rather than contesting it.
Adobe describing a product that competes with The Trade Desk's — “an end-to-end, demand-side platform” spanning video, display and search across channels and screens — while filing it under a segment Adobe itself labels “legacy,” alongside eLearning, web conferencing and PostScript printing. The classification, not the product description, is the exhibit: this is a scaled software company declining to treat programmatic buying as a growth business.
Our Publishing and Advertising segment contains legacy products and services that address diverse market opportunities including eLearning solutions, technical document publishing, web conferencing, document and forms platform, web App development, high-end printing and our Adobe Advertising offerings. […] Adobe Advertising delivers an end-to-end, demand-side platform for managing advertising across digital formats and simplifies the delivery of video, display and search advertising across channels and screens. […] We generate revenue in our legacy Publishing products and services by licensing our technology to original equipment manufacturers that manufacture workflow software, printers and other output devices, and we generally generate revenue in Advertising through usage-based offerings.
p. 7 · Read in context →
A year later, the standalone description of Adobe Advertising as a demand-side platform is gone from the segment discussion, and from fiscal 2026 the segment that housed it stops being reported separately at all. The scale involved is small: p61 of the same filing puts total Publishing and Advertising revenue at $256 million in fiscal 2025, down 7% and about 1% of Adobe's revenue — and that figure covers the whole legacy bundle, not the DSP alone. For a competitive read on the DSP market, the signal is disclosure being withdrawn rather than a competitor scaling up.
Publishing and Advertising. Our Publishing and Advertising offerings contain legacy solutions including eLearning solutions, technical document publishing, web conferencing, document and forms platform, web App development, high-end printing through Adobe PostScript and Adobe PDF standards and our Adobe Advertising offerings. […] Effective in the first quarter of fiscal 2026, we will combine our prior segments—Digital Media, Digital Experience and Publishing and Advertising—into a single operating and reportable segment due to changes in how management intends to evaluate results, allocate resources and execute the strategic opportunities outlined above.
p. 18 · Read in context →
More peer documents
Viant Technology — FY2025 Form 10-K — FY2025 · 115 pages · Page 14's Competition section names The Trade Desk in Viant's own market definition (“public companies exclusively serving our industry, such as The Trade Desk”), repeated as a risk factor on p26; p45 discloses that a former TTD Chief Legal Officer sits on Viant's board. · Open →
Viant Technology — Q4 FY2025 earnings call — Q4 FY2025 · 15 pages · Pages 12–14 are management's read on The Trade Desk–OpenAI, why they think it does not fit the RTB protocol on privacy grounds, and a jab at agency lock-in (“you do not need to go to Trade Desk Academy for two weeks”). · Open →
Alphabet — Q4 FY2025 earnings call — Q4 FY2025 · 11 pages · Page 1 puts YouTube's annual revenue above $60bn across ads and subscriptions; p5 has the Network line at $7.8bn down 2%, the cleanest quarterly datapoint on Google's shrinking third-party inventory business. · Open →
Alphabet — FY2025 Form 10-K — FY2025 · 99 pages · Page 54 lists the buying surfaces Google sells through — Google Ads, Google Ad Manager, Display & Video 360, Google Marketing Platform — and p20 carries the risk-factor version of the ad-tech remedies exposure quoted here from the legal note. · Open →
Nexxen — Q1 FY2026 earnings call — Q1 FY2026 · 33 pages · Pages 10, 11 and 18 track the TTD relationship forward: TTD, StackAdapt, Basis and others onboarding to the home-screen solution, AdForm joining the data-licensing roster, and management's account of why they led with The Trade Desk (“the standards and the reputation”). · Open →
Criteo — Q2 FY2025 earnings call — Q2 FY2025 · 15 pages · Page 3 lays out the cross-channel/full-funnel/self-service strategy and the plan to scale “curated supply with retailer data deals easily accessible through any DSP” — Criteo positioning itself as a data layer inside other platforms, TTD included. · Open →
Fit
Outside the framework's universe (U2 not met); contested: X1, X2, X3, X4, S1, P5
At $17.29 the equity is worth $8.53 billion, 14.7% below the framework's $10 billion line; U2 not met resolves the tab before any pillar is weighed. Confidence is low on the tally's stated basis — name-mask divergence or load-bearing probability divergence above 0.20 — and the mask probe did differ, on X1 through X4. No exclusion was hit, the watchlist-only overlay is not set, and six criteria are recorded contested.
The confidence basis matters as much as the tier. Two model families sat on the jury and agreed on every pillar verdict except one; what pushed the tier to low was the name-masked probe returning a different label from the unmasked jury on the four exclusion tests, which sets the prior_driven_risk flag. The tally's own arithmetic gap between masked and unmasked probabilities is 0.02.
Universe and exclusions
Market cap ($M)
Universe line ($M)
Shortfall vs line
Break-even share price
Source: derived — 493,551,000 shares (FY2025 income statement basis) at the $17.29 close of 24 July 2026, per fit_features.market_cap; the $10 billion line is the framework's own.
U2 — Scale: not met. This is not a valuation judgment and not a quality judgment. It is a size test, and the company is below it: 493,551,000 shares at $17.29 computes to $8,533,496,790 against a $10,000,000,000 line, a shortfall of $1.467 billion, or 14.7%. The share price that would clear the line is $20.26. The counter-fact in the same breath, and it is a real one: the miss is a price event of recent vintage, not a shrinking business. The last close at or above $20.26 was 4 June 2026, at $21.03 — seven weeks before the reference date — and over the fiscal year just reported revenue grew 18.5% to $2,896.3 million, operating cash flow grew 34% to $992.7 million and gross spend grew 11% to $13,394.7 million [1]. All three jury seats that voted on U2 returned not met, and the masked seat agreed. The framework's rule is a level, measured on the date; the tally applies it as U2 not_met -> out_of_universe.
U1 — Listing: met. Class A common stock has traded on the Nasdaq Global Market under TTD since 21 September 2016 [2]; the issuer is Nevada-incorporated and headquartered in Ventura, California, is not an ADR and is not a Chinese issuer. Three seats, unanimous. The one structural caveat sits outside the test: unlisted Class B stock carries ten votes per share [3], which bears on control rather than listing venue.
The exclusion screen is clean of hits. The tally records exclusion_hits: []. Every seat that voted found the auto-manufacturer test (X1), the promotional-CEO test (X2), the structural-decline test (X3) and the consensus-saturated-story test (X4) unhit, and the China sensitivity flag (S1) unraised — but each of those five is recorded contested because the seats returned different labels for that finding, and the aggregate carries that as a split. The evidence behind each:
- X1 — Auto OEM. One operating segment, the advertising technology platform; no manufacturing operations disclosed; property, equipment and lease assets of $738.9 million are offices and hosting infrastructure [4]. Automotive appears in the record only as an advertiser vertical.
- X2 — Promotion pattern. The test needs both prongs. The ownership prong fails outright: the founder-CEO holds 11.2% of the equity, about $926 million at $17.29, and bought 6,000,000 shares in the open market for $148.1 million on 2–4 March 2026 at an average of $24.68. Against that, on the same page of the record: those purchases are 29.9% underwater, the Class B structure gives 49.7% of the vote on 11.2% of the economics, four directors resigned in five weeks in March–April 2026, the chief financial officer's chair has held four occupants in eighteen months, and a consolidated securities class action carries a Section 20A insider-trading count against the CEO, then-CFO and CSO. Full treatment in Self-Help.
- X3 — Structural decline. Revenue rose in each of the ten reported fiscal years, from $202.9 million in FY2016 to $2,896.3 million in FY2025;
consecutive_decline_yearsis 0 and the three-year high-single-digit decline flag is false. The counter-fact is deceleration rather than decline: gross-spend growth fell from 25.3% to 11.2%, Q1 FY2026 revenue grew 11.8%, the Q2 FY2026 guide of at least $750 million implies 8.1% at its floor [5], and Google Network revenue — the closest recurring measure of third-party publisher advertising — fell in each of 2023, 2024 and 2025, from $31,312 million to $29,792 million [6]. - X4 — Consensus-saturated story. Tested at today's price, not the peak: 2.95 times FY2025 sales against 28.6 times at the 4 December 2024 peak, 23 of 36 ratings at hold or lower, and an 88.0% drawdown. The skeptic pass weakened this claim on one leg — the Viant Technology 2.08x peer multiple rests on a share price the corpus does not carry — so the peer comparison is set aside and the three corpus-supported tests stand on their own. What survives as a residual observation, not a screen result: a business that carried 28.6 times sales nineteen months ago is cheap because of an active share-loss narrative, not because investors stopped looking.
- S1 — China dependence (flag only, not raised). The company discloses revenue as United States $2,476.7 million (85.5%) and International $419.6 million (14.5%) [7], with international property, equipment and lease assets at 11.7% of the total [8]. China is named twice in the FY2025 10-K, both times inside a list of growth-opportunity markets alongside the United Kingdom, Germany, France, Japan, India and Australia. The ceiling on China revenue is therefore 14.5% by construction and almost certainly a small fraction of that — but the corpus carries no China line, so the figure cannot be sized, and absence of disclosure is evidence of immateriality under SEC thresholds rather than of absence.
Pattern match
Against the reader contract's four recognition setups, this fits none of them cleanly, and the nearest one fails on its own check.
The closest is quality tech monopoly or duopoly on a fear dip — the precedent shape is a franchise whose average top-to-bottom swing runs far wider than any change in its value, bought when the fear is specific and testable. Two of that pattern's markers are present: the fear is specific (an inventory-owning rival taking connected-television share) and the drawdown is deep enough to qualify on any reading. The structure check is where it fails, and it fails on the issuer's own words: "Our industry is highly competitive and fragmented. We compete with other demand-side platform providers, some of which are smaller, privately held companies and others are divisions of large, well-established companies such as Google and Amazon" [9]. That sentence has appeared in every annual report since FY2021, with the named rivals changing from Google and Adobe [10] to Google and Amazon. Scale runs the same way: FY2025 gross spend of $13.4 billion is 19.5% of Amazon's $68.6 billion of advertising services revenue [11] and 4.5% of Google's $294.7 billion of advertising revenue [12]. A duopolist does not describe itself as one of many in a fragmented field.
The other three patterns are absent on their entry conditions. Cyclicals at the bottom, large banks only — not a bank, not a cyclical with a monthly loss-rate series to read against macro fear. High dividend plus high FCF yield — no dividend has ever been declared or paid, none is anticipated, and the credit agreement restricts payment [13]. Healthcare or insurance forecasting error — there is no regulated repricing mechanism here; advertising budgets have no annual rate filing that mechanically readjusts the book, which is precisely what the Clock tab finds when it looks for a repricing cycle and finds an execution clock instead.
The pillar ledger
Source: ruchir/fit_tally.json — per-criterion verdicts, vote splits, trimmed-mean probabilities and spreads, as recorded by the deterministic tally.
Year-10 durability (P1) — not met
The gate is binary by construction, and any proper doubt resolves it. All four seats returned not met, at a trimmed-mean probability of 0.585 with a spread of 0.04 — the tightest agreement anywhere in the ledger.
The deciding arithmetic is that none of the framework's five conviction sources is present on the company's own filed description. Market structure: the issuer calls its industry highly competitive and fragmented [14], and $13,394.7 million of gross spend is 1.9% of the $700 billion digital advertising market the company itself sizes [15]. Regulatory entry barriers: no licensing regime is disclosed anywhere in the 10-K. Capital intensity: FY2025 capital expenditure of $197.0 million is 6.8% of revenue, and net property and equipment of $396.8 million is 6.4% of $6,153.2 million of total assets. Essential products: master services agreements "do not contain any material commitments on behalf of clients" and are "terminable at any time upon 60 days' notice by either party" [16]. Operating history: incorporated November 2009, listed September 2016 — about 16 years old and under ten years public, against a 30-to-50-year reference. What is left protecting year-10 cash flow is execution plus a 21.6% take rate, and the framework does not count execution as a moat.
The strongest surviving counter-fact belongs in the same treatment, because it is substantial. Revenue has grown in all ten reported fiscal years and stands at 14.3 times its FY2016 level; the client retention rate exceeded 95% in each of the eleven years to FY2024 [17]; the platform draws inventory from over 430 directly integrated exchanges, publishers and supply-side platforms and more than 370 third-party data vendors [18]; the balance sheet carries no funded debt against $658.2 million of cash and $644.9 million of short-term investments [19]; and consensus free cash flow rises from $780 million in FY2026 to $1,098 million in FY2029. The gate did not fail because the business is weak. It failed because the sources of conviction the framework requires — structure, regulation, capital, essentialness, longevity — are not the sources of this company's strength. Full treatment in Durability and Business.
Scale asymmetry frames the doubt: Amazon's advertising services revenue of $68,635 million is 23.7 times The Trade Desk's revenue and grew 22.1% in FY2025 [20], while the chief executive told the Q3 FY2025 call: "Looking ahead to the next ten years, I doubt Amazon will develop a DSP as we understand it" [21]. Two companies made incompatible claims in the same quarter, and neither discloses demand-side-platform revenue, so the primary record cannot settle it.
FCF consistency (P2) — not met
Four seats, unanimous. The framework's basis is adjusted free cash flow — reported free cash flow less stock-based compensation less the trailing five-year average of acquisition spend — and the feature file returns not_computable for every year FY2016–FY2025 because stock compensation is absent from the structured cash-flow feed. Recomputed from the filed statements [22], the rolling five-year averages are $33.4 million (FY2019–23), $73.5 million (FY2020–24) and $89.9 million (FY2021–25). Only three complete windows exist, and the average nearly tripled across them — rising, not stable — while adjusted free cash flow itself was negative in three of the seven years to FY2025 (FY2019, FY2021, FY2022). Neither the stability the criterion asks for nor the business-model-inherent 5-to-8-year negative episode it tolerates is what the series shows.
The counter-fact carried in the same treatment: those negative years are stock-compensation artefacts rather than operating shortfalls. Reported free cash flow was positive and rising in every year on record, from $24.5 million in FY2019 to $795.7 million in FY2025, and stock compensation has been flat in dollars for four years ($498.6M, $491.6M, $494.7M, $490.6M) while revenue grew 83.6%, taking it from 31.6% to 16.9% of revenue and lifting adjusted free cash flow 5.3 times in two years, from $57.3 million to $301.6 million.
Dislocation and yield (P3a, P3b, P3c, P3d)
Source: derived — adjusted FCF = reported FCF minus stock-based compensation minus the trailing 5-year average of acquisition spend, computed from the filed cash-flow statements [23], over the $8,533.5 million market capitalisation; the 8.5% line is the framework's fortress bar.
P3a — Identifiable event: met, four seats. Two dated adverse events produced the two largest single-day falls: the Q4 2024 revenue miss reported on 12 February 2025 [24], followed by a 32.98% decline the next session, and the guidance reset [25] with a simultaneous chief financial officer departure on 7 August 2025 [26], followed by 38.61%, the largest one-day fall in the company's history. The counter-fact that sits inside this reading, and it is the one that separates this case from the framework's canonical setup: there was no near-term earnings cut in level terms. FY2026 consensus earnings per share of $1.85 is 4.6% above the FY2025 actual of $1.77, and consensus revenue of $3,177.1 million is 9.7% above FY2025. What was cut is the growth rate — guided quarterly growth stepped from 17.0% to 8.1% across six consecutive guides — and the price fell 87.6% against it.
P3b — Capitulation: met, four seats. The maximum 20-day average volume during the fall was 8.89 times the pre-peak median, against a 2x reference line, with single sessions at 36.1x (8 August 2025) and 28.3x (5 March 2026). The counter-fact is a timing problem rather than a level problem: that 8.89x window ended 24 March 2026, at closing prices of $22.34 to $29.79, which is 29% to 72% above today; at the 23 July 2026 low the trailing 20-day average was 4.48x, the lightest reading in five months. Peak fear was four months ago and the price is lower. Full treatment in Dislocation.
P3c — Yield versus the bar: not met, four seats, at 497 basis points short. The balance sheet is net cash — $1,303.1 million of cash and short-term investments against zero drawn debt at FY2025 year-end [27] — which selects the fortress reference line of 8.5%, the most favourable of the three bars available. On that line: FY2025 adjusted free cash flow of $301.6 million over the $8,533.5 million market capitalisation is 3.53%, the three-year average is 1.96%, and the trailing twelve months to 31 March 2026 is 4.31%. The single number that carries the most weight in the other direction is the unadjusted one: reported free cash flow of $795.7 million is a 9.32% yield, above the bar. The gap between 9.32% and 3.53% is stock-based compensation of $490.6 million [28], and the framework's basis subtracts it. Adjusted free cash flow has risen every year since FY2022, from minus $36.7 million to $301.6 million, because that expense has been flat in dollars while revenue grew 83.6% — the trajectory is toward the bar, from a long way below it.
P3d — Forward path: not met, four seats, at a trimmed-mean probability of 0.18 with a spread of 0.08. Consensus free cash flow clears the bar on the vendor's own definition — 9.14% for FY2026 and 10.35% for FY2027 on today's market capitalisation — but that definition is cash from operations less capital expenditure, which adds stock compensation back. Restated onto the framework's basis with stock compensation held flat, the same consensus gives 3.35% in FY2026 rising to 7.08% by FY2029; banking the chief executive's performance option roll-off in full lifts the series to 4.17% and 7.95%. Neither path reaches 8% anywhere in the estimate horizon. Reaching the bar by FY2028 requires $682.7 million of adjusted free cash flow, which needs reported free cash flow about 14% above consensus, or a 43% cut to stock compensation against $290 million a year of already-committed amortisation. The skeptic pass weakened the point estimate and it is carried as a range: roughly 10% to 30%, with 20% the working figure. Full treatment in Yield.
Balance sheet and self-help (P4a, P4b, P4c)
P4a — Outlast and allocation headroom: met, four seats. At 31 March 2026 the company held $878.4 million of cash and $527.5 million of short-term investments [29] against zero funded debt and an undrawn $750 million revolver maturing 14 April 2031; the maturity ladder is leases only, cash interest paid in FY2025 was $0.993 million, and working capital is $1,971.2 million. Debt paydown cannot become the competing use of cash, because there is no debt to pay down. The counter-fact in the same treatment: cash and short-term investments fell from $1,921.5 million to $1,303.1 million over FY2025 because repurchases of $1,380.4 million exceeded that year's free cash flow of $795.7 million by $585.1 million — the balance sheet is funding the buyback, not the other way round.
P4b — Repurchase engine: not met, on the ledger's only genuinely split vote: one seat met, three not met, and cross-family agreement false. The program is executed rather than announced — $2,445.8 million of repurchase value against $2,761 million authorised, 45,944 thousand shares retired program to date — but 57.6% of it was absorbed by reissuance to employees, so the share count fell 4.0% from 490,468 thousand at end-2022 [30] to 470,999 thousand at 31 March 2026 [31], and the filings describe the program's purpose as offsetting dilution. The average price paid across the program is $53.23 against $17.29 today. The dissenting seat's case is on the record too: the count fell 4.1% in FY2025 alone and 5.06% over five quarters from its 2024 peak, and March 2026 repurchases were struck at $24.31, the lowest of the program. Full treatment in Self-Help.
P4c — Dividend cover: not applicable, four seats. No dividend has ever been declared or paid, none is anticipated, and the credit agreement restricts payment [32]. No part of the return case depends on one.
Diagnosis (P5) — contested
The temporary-or-permanent question was decided by the profile's adversarial trial: two opposing cited briefs, three judges reading in different orders. The result is a probability that the impairment is temporary of 0.41, with a mean of 0.4633 and a spread of 0.30 across per-judge readings of 0.34, 0.41 and 0.64. The tally records it as contested, and it is not order-stable: the seat that read the temporary brief first came out at 0.34, while the two that read the permanent brief first averaged 0.525 — a reading-order gap of 0.185. All four jury seats carried the trial result rather than re-deriving it.
The cash-flow arithmetic behind the two readings, on identical assumptions of a 10% discount rate and 3% terminal growth from year eleven: on reported free cash flow the shares at $17.29 sit 52% below the permanent-scenario value of $35.76; on the framework's adjusted basis, once the $462.2 million of stock compensation consensus carries for FY2026 is removed, the same permanent scenario values the equity at $16.11 and the shares sit 7% above it. The skeptic pass weakened this claim on sensitivity and the range is carried: across a 9%–11% discount rate and 2%–4% terminal growth, the adjusted permanent value spans $13.64 to $20.48, so at 9% and 3% the price flips back below value. The counter-fact from the trial itself: the 0.64 seat discredited the permanent brief's only attempt to show declining earning power — Q1 FY2026 net income of $40.0 million against $50.7 million — on the ground that pretax income rose and operating income rose 22%, making the fall a tax-rate artefact. Three quote checks failed across the two briefs, one against the temporary case and two against the permanent case. Full treatment in Damage Math.
Instrument context (I1) — not verifiable
Four seats, unanimous, and this criterion never blocks a pillar verdict. Listed options on TTD do extend to 21 January 2028 — 545 days, or 17.9 months, from the reference date, clearing the framework's 12-month test and reaching its 18-month preference — with intermediate expiries at 15 January 2027, 19 March 2027 and 17 June 2027. Implied volatility reads 84.63% on the 30-day mean and 72.54% on the 180-day mean, both dated 24 July 2026, against the framework's reference lines of roughly 55 acceptable and 60–70 elevated. The reason the criterion returns not verifiable rather than exists: every one of those figures is web-sourced, the corpus carries no option chain, and the named missing datapoint is aggregate open interest and bid-ask spreads on the long-dated contracts from a dated citable source — three vendors returned HTTP 403 to automated retrieval. Because the tally could not establish the instrument facts, the watchlist-only overlay is not set; that flag reads false. Full treatment in Clock.
What a 3x-in-3-years would require
The tally returns no re-rating arithmetic. Its note, in full: Re-rating math unavailable because the applicable bar or normalized adjusted FCF is missing.
The reason is specific and worth stating plainly. fit_features.adjusted_fcf, adjusted_fcf_yield, yield_baseline, fcf_stability and float_retirement_years all return not_computable because stock-based compensation is absent from the structured cash-flow feed for every fiscal year FY2016–FY2025, and balance_sheet_class returns unknown because debt or cash is missing for FY2025. Every adjusted figure on this tab was recomputed from the filed statements instead, and flagged as such — but the deterministic re-rating engine takes its inputs from the feature file, and it had none. No price-at-bar and no upside-to-bar can be published from this run.
What can be published is the base-rate context the Clock tab established from this name's own history. Seven completed drawdowns of 30% or more have occurred since the September 2016 listing; their median depth is 35.6% and their median round trip 165 days. The deepest, at 64.27%, ran 358 days to its trough and 1,053 days — 2.88 years — from peak back to peak, and it did so while FY2022 revenue grew 31.9%. The current episode is 87.97% deep and 596 days old, with the low set on 23 July 2026, one session before the reference date. Measuring forward from each of the seven prior troughs, the median 12-month gain was 171% and the median 24-month gain 377% — every one of those troughs occurred while revenue compounded 23% to 55% a year, against FY2026 consensus growth of 9.7%, so the recovery base rate is drawn from a materially different business. For scale on the nearer horizon: the sell side's mean target of $24.32 is 40.7% above the close, and the prior peak is 707% above it.
Contested and undetermined
Six criteria are recorded contested. Nothing returned cannot-determine.
X1, X2, X3, X4 and S1 are contested on the same mechanism. Three seats voted each of them; every seat's stated basis is that the exclusion is not hit (or, for S1, that the sensitivity flag is not raised); and the three seats expressed that finding with three different labels — seat a "not_met", seat b "no_hit", seat c "not_hit". The tally counts differing labels as a split, so cross-family agreement is recorded false and each criterion carries forward as contested. The masked seat returned "not_met" on all four exclusions, which is what the mask probe flags as a gate-criterion difference against the unmasked aggregate; the arithmetic distance between masked and unmasked probabilities is 0.02. Both readings, stated plainly: on the substance every seat found no exclusion hit, and the tally records the criteria as contested. The second reading is the one the deploy carries.
P5 is contested on substance, not labelling. All four seats returned contested, carrying the trial's 0.41 with its 0.30 spread and 0.185 reading-order gap. The temporary reading: three quantified, dated drags (the Publicis pause, the tariff-affected consumer-goods comp, the political comp) explain the deceleration, the take rate rose rather than fell, and reported cash flow has never declined. The permanent reading: an inventory-owning competitor 23.7 times the size has taken exclusive positions in the company's largest channel, the take rate carried 7.2 of FY2025's 18.5 points of revenue growth and a holding-company fee audit is aimed at exactly that take rate, and six consecutive guides have stepped down. The trial did not choose between them, and neither does this tab.
Undetermined: no criterion returned cannot-determine. I1 returned not verifiable, with its missing datapoint named above — aggregate open interest and bid-ask spreads on the long-dated contracts, from a dated citable source.
Provenance
| Dimension | Reading |
|---|---|
| Jury composition | Four voting seats plus a name-masked probe. Seats a and b from one model family, seats c and d from a second; the masked seat from the first. Universe and exclusion criteria were voted by three seats; the pillar criteria by four. |
| Agreement and spread | Cross-family agreement holds on U1, U2, P1, P2, P3a, P3b, P3c, P3d, P4a, P4c and I1. It fails on X1, X2, X3, X4, S1 (label divergence), P4b (one seat met against three not met) and P5 (contested on all seats). Widest probability spread: P5 at 0.30. Tightest: P1 at 0.04. |
| Trial order-stability | Not stable. The seat reading the temporary brief first returned 0.34; the two reading the permanent brief first averaged 0.525. Gap 0.185. |
| Name-mask probe | prior_driven_risk is true. The masked jury differed from the unmasked aggregate on X1, X2, X3 and X4; maximum probability gap 0.02. |
| Skeptic counts | 55 ledger claims entered the pass, 16 fully recomputed. Verdicts: 11 survived, 6 weakened, 0 refuted, 1 unverifiable, 37 triaged only. |
Source: ruchir/fit_tally.json provenance block and ruchir/refutations.json.
Two sentences on what that means. Nothing in this verdict rests on a single model's reading: two families voted independently on every criterion, a fifth seat voted the same evidence with the company's name stripped out, and every verdict-bearing claim was handed to a skeptic that recomputed the arithmetic and re-opened the cited pages before the jury saw it — six claims came back weakened and are carried on this tab with the weakening stated. The confidence tier is low not because the universe test is doubtful (it is unanimous and arithmetic) but because the mask probe and the unmasked jury labelled the exclusion tests differently, which the tally treats as a signal that prior knowledge of the name may be doing work.
The falsifier ledger
These are the standing conditions that would change the readings above. The first five are the framework's own templates, applied to this name; the rest are the trial's dated flip conditions.
| Framework condition | Direction | Window |
|---|---|---|
| adjusted FCF or EBITDA declines where flat-or-better was underwritten | Breaks the durability underwrite | Any reported period |
| revenue declines for a third consecutive year | Triggers the P1 disqualifier | Annual; none recorded to date |
| capital allocation pivots to debt paydown over repurchases | Breaks P4a | Currently inapplicable — no funded debt |
| share count inflects upward | Hard-fails P4b | Quarterly equity statement |
| the industry repricing cycle fails to materialize where industry-wide mean reversion was underwritten | Breaks the mean-reversion path in P3d | 1–3 years |
| Condition that would support the temporary reading | Window |
|---|---|
| Q3 FY2026 (reports November 2026) revenue growth of 13%+ — a full quarter with Publicis spend restored (settled 12 June 2026) and the midterm political comp — which would establish the ~8% Q2 guide as pause-distorted rather than the structural run rate. | November 2026 (estimated) |
| FY2026 gross spend growth accelerates above the 11% recorded in FY2025 [33] while revenue/gross spend holds at or above 21.6% — showing neither platform volume nor take rate was repriced by the Publicis fee audit. | FY2026 results, February 2027 (estimated) |
| TTD discloses CTV growing faster than the total business for two further quarters after Amazon's exclusive Roku/Disney footprint is fully live, with total growth recovering — refuting the channel-share mechanism that makes this lasting rather than cyclical. | Two consecutive quarters |
| FY2026 Adjusted EBITDA margin lands at or above 40% with opex ex-SBC growth back below revenue growth, reversing Q1 FY2026's negative operating leverage (opex ex-SBC +18% on revenue +12%). | FY2026 results |
| Q3 and Q4 FY2026 revenue reaccelerates to mid-to-high-teens growth after Publicis resolution and political spend returns, while full-year adjusted EBITDA margin remains at least 40%. | November 2026 and February 2027 |
| FY2026 revenue/gross spend stays near the FY2025 take rate and no major holding company or vertical materially reduces gross billings. | FY2026 results |
| FY2027 revenue and EPS revisions turn net positive for at least two consecutive quarters. | Two consecutive quarters |
| CTV share and pricing remain stable despite Amazon DSP's Roku and Disney integrations. | Ongoing |
| Condition that would support the permanent reading | Window |
|---|---|
| Q2 FY2026 (6 Aug 2026) revenue below the $750m guide, or FY2026 adjusted EBITDA margin guided below 40% — the first actual break in the never-declined cash-flow record that the temporary case rests on entirely. | 6 August 2026 |
| Q3 FY2026 growth fails to exceed ~10% despite the resolved Publicis dispute, the lapped tariff/CPG comp and the midterm political comp — that would convert management's three quantified, dated drags into a structural deceleration and validate the consensus curve. | November 2026 (estimated) |
| FY2026 revenue/gross spend falls below 20% (from 21.6% in FY2025), or TTD discloses a Publicis/holding-company fee concession with revenue impact — direct evidence the take rate, not the cycle, was repriced. | FY2026 results |
| TTD discloses CTV growing SLOWER than the overall business, or a named CTV supply partner going Amazon-exclusive — the Q4'25 disclosure that CTV grew faster than the company through 2025 is the load-bearing fact separating a vertical-cycle story from an Amazon-share-loss story. | Any quarter |
| Buybacks suspended or the $750m revolver drawn for operations. | Any quarter |
Source: ruchir/fit_tally.json falsifier ledger and ruchir/trial/tally.json flip conditions; the FY2025 gross-spend figure of 11% is at [34].
The nearest of these is the 6 August 2026 print. The FY2026 adjusted EBITDA margin commitment — "at least 40%, approximately in line with 2025" [35] — is unresolved as of this run, because the corpus ends with the Q1 FY2026 call of 7 May 2026.
Data gaps
The tally records 45 data gaps. They fall into seven groups; the ones that constrain this tab's arithmetic come first.
The adjusted-FCF basis is not in the numeric feed. fit_features.adjusted_fcf, adjusted_fcf_yield, yield_baseline, fcf_stability and float_retirement_years all return not_computable because data/financials/cash_flow.json carries no stock-based-compensation field for any fiscal year FY2016–FY2025, and the acquisitions field is absent entirely. Every adjusted figure on this tab and on Yield, Durability and Self-Help was recomputed from the filed cash-flow statements under the profile's definition and labelled as such. This is also why the re-rating arithmetic could not be produced.
The balance-sheet class is not computed. fit_features.balance_sheet_class returns unknown ("debt or cash missing for FY 2025") even though the filed balance sheet reports both. The fortress classification that selects the 8.5% bar was established from the 10-K balance sheet and credit-facility disclosure rather than the feature.
Share-count basis conflicts across sources. fit_features.market_cap uses 493,551,000 shares (a weighted-average diluted figure from the FY2025 income statement); the 10-K cover page reports 475,977,047 outstanding at 31 January 2026 and the Q1 FY2026 10-Q reports 470,999,000 at 31 March 2026. Every yield and multiple on this tab uses the feature file's basis. On the cover-page count the market capitalisation is $8,230 million and the FY2025 adjusted yield 3.66% rather than 3.53% — neither basis clears the $10 billion universe line.
Competitive share cannot be settled from the primary record. Neither The Trade Desk nor Amazon discloses demand-side-platform revenue or market share, and no third-party DSP share data is present in the corpus. Every share statement in this run is a ratio of disclosed revenue or gross spend against the company's own $700 billion market sizing. TTD does not disclose CTV revenue in dollars, so the central feared event has no quarterly metric that can confirm or refute it — channel mix in prepared remarks (video including CTV at a low-50s percent of Q1 FY2026) is the only read available, and it has never been a filed figure in any 10-K. The company reports a single operating segment with no expense detail below the consolidated income statement, so no channel or geographic economics can be derived [36].
China cannot be sized. No China-specific revenue, asset, headcount or risk-factor disclosure exists anywhere in the indexed corpus. The tightest bound is the 14.49% of FY2025 revenue booked as International, a bucket that also contains all of EMEA and APAC.
Market and positioning data are thin or web-sourced. The dedicated web-research provider was unavailable for this run (the API returned a 402 insufficient-credit error), so universe verification, seller composition, the option chain, implied volatility and the Publicis dispute chronology were sourced by general web search and are dated July 2026. No reported short-interest series exists: FINRA returned zero position rows and every file under data/short_interest/ is empty, so the short-interest levels used in the seller-composition claim are not corpus-sourced — the skeptic pass weakened that claim on exactly this ground. Aggregate option open interest could not be obtained from any citable source. No 13F holder-level turnover is staged, so institutional selling is visible only through 5% crossings. Consensus revision history reaches back 180 days for FY2027/FY2028 and 90 days for FY2026, so the estimate path across the first fourteen months of the drawdown cannot be reconstructed, and the company's own six-guide sequence was used as the before-and-after record instead. Whether the company remains an S&P 500 constituent as of 24 July 2026 is not confirmed by any document in the corpus.
Two forward quarters are unobserved. Q2 FY2026 results (due 6 August 2026) are unreported, so the first full quarter carrying restored Publicis spend, a lapped tariff comp and the midterm political comp has not printed — the single largest determinant of whether the temporary or the permanent scenario applies. Q3 and Q4 FY2026 earnings dates are not yet scheduled; the November 2026 and February 2027 windows used above are inferred from the company's reporting pattern and are labelled as estimates. Stock compensation before FY2019 is not in this corpus, so only three complete rolling five-year adjusted-FCF windows exist, and quarterly revenue in the numeric feed contains no fourth quarters, so quarter-level recession testing could not be sourced to a filing page.
What This Tab Establishes
The Trade Desk sells one thing: a self-service platform that ad buyers use to place programmatic ads across the open internet, priced as a percentage of what they spend through it. It clears the geography test — a Nasdaq-listed US company, no ADR, no China listing — and misses the size test, at a market capitalisation of $8.5 billion against the $10 billion line. On market structure, its own 10-K describes the industry as "highly competitive and fragmented" [1].
The Universe Screen
The Trade Desk's Class A common stock has traded on the Nasdaq Global Market under the symbol "TTD" since September 21, 2016 [2]. The company was incorporated in November 2009, is a Nevada corporation, and is headquartered in Ventura, California [3]. This is a US primary listing of a US operating company — not an ADR, not a foreign private issuer, and not a Chinese issuer in any form. The geography criterion is met without qualification.
The size criterion is not. At the July 24, 2026 close of $17.29 on 493.55 million shares outstanding, market capitalisation computes to $8.53 billion — $1.47 billion, or 15%, below the $10 billion line. The share price would need to reach $20.26 for the company to re-enter the universe on the current share count; it last closed above that level on June 4, 2026. Independent market data for July 2026 puts the figure in the same place, at roughly $8.5–8.7 billion, so this is not an artefact of a stale share count. The miss is recent and marginal, and it is a price fact rather than an operating one: revenue, cash flow and headcount all grew in the year that produced it.
Market capitalisation of $8.53 billion at the July 24, 2026 close sits below the framework's $10 billion universe threshold. The last close above the equivalent $20.26 share price was June 4, 2026, seven weeks earlier; the shortfall is a consequence of an 88% share-price decline from the December 2024 peak, not of a small operating base.
Market Cap ($B)
Universe Bar ($B)
Close, 24 Jul 2026 ($)
Price to Clear Bar ($)
Source: 493,551,000 shares outstanding at FY2025 year-end times the $17.29 close of 24 July 2026; derived from the deterministic feature file (fit_features.market_cap.usd) and company price data, as reported.
The company is a member of the S&P 500, added in July 2025 — a fact drawn from market data rather than the filings, and one that says more about where the market cap was a year ago than about where it is now.
What the Company Sells
The Trade Desk operates a demand-side platform. Advertisers and the agencies that represent them log into its software, set campaign objectives, and the platform bids on their behalf in real-time auctions for advertising inventory — a slot in a streaming show, a display unit on a website, an audio spot in a podcast. The company describes itself as empowering "ad buyers to create, manage and optimize digital advertising campaigns across ad formats, channels and devices," with the platform supplemented by enterprise APIs for clients who want to build on top of it [4].
It makes money by charging "a platform fee generally based on a percentage of our clients' total platform spend," plus fees on value-added services and data supplied through the same pipe [5]. Because the company acts as an agent, it reports revenue net of what it pays inventory and data suppliers — which is why "both accounts receivable and accounts payable appear large in relation to revenue reported on a net basis" [6] — receivables of $3.77 billion and payables of $3.01 billion against $2.90 billion of reported revenue [7]. The gross flow through the platform — what the company calls gross spend — was $13.39 billion in FY2025 [8].
There is one operating segment: the advertising technology platform. The chief operating decision maker reviews the business on a consolidated basis, and no expense detail is disaggregated below the consolidated income statement [9]. So there are no segment economics to compare; the economics are the take rate, the channel mix, and the operating cost base.
FY2025 Revenue ($M)
FY2025 Gross Spend ($M)
FY2025 Adj. EBITDA ($M)
Employees, 31 Dec 2025
Sources: FY2025 10-K executive summary highlights [10]; headcount from Item 1 Human Capital [11].
In two sentences: The Trade Desk is a $2.9 billion-revenue software company that takes roughly a fifth of the $13.4 billion advertisers route through its ad-buying platform each year, mostly in the United States and mostly for connected-TV and mobile campaigns. It employs 3,843 people in 21 countries, has never paid a dividend, and competes for that spend against the in-house ad platforms of Google and Amazon.
Take Rate and Cost Base
Two numbers describe the model: how much advertiser budget flows through the platform, and what share of it the company keeps. Both moved in FY2025, in opposite directions.
Sources: FY2025 10-K highlights for FY2025 and FY2024 [12]; FY2024 10-K highlights for FY2023 [13]; FY2023 10-K highlights for FY2022 [14]. Take rate = revenue divided by gross spend; derived from company filings.
For three years the take rate sat within 13 basis points of 20.3%, and revenue tracked spend almost exactly. In FY2025 the two split: gross spend growth halved to 11.2% while revenue grew 18.5%, because the take rate went to 21.6%. Management attributes the gap to "increased utilization of our value-added services and data; and higher platform fees," including "increased pricing associated with value-added services and data" [15]. The company's own risk disclosure states the reverse case plainly: "growth in spend may outpace growth in our revenue due to a number of factors, including pricing competition, volume discounts and shifts in media, client and channel mix" [16]. Price is doing work that volume did before.
Below the revenue line, FY2025 operating margin was 20.3% and net margin 15.3%, on total operating expenses of $2.31 billion — of which sales and marketing was the single largest line at $644 million, or 22% of revenue [17]. Free cash flow was $796 million on capital expenditure of $197 million [18]. The cash-flow arithmetic and its adjustments belong to Yield.
Where the Revenue Sits
Sources: FY2025 10-K Note 12, revenue by principal geographic area [19]; Q1 FY2026 share from the Q1 2026 earnings call [20].
The United States supplied 85.5% of FY2025 revenue and 88.3% of property, equipment and lease assets [21][22]. International is the faster-growing half of a small base, reaching roughly 18% of revenue in Q1 FY2026.
By channel, in Q1 FY2026 video including CTV was a low-50s percentage of the business, mobile a high-28s percentage, display low double digits, and audio around 6% [23]. That mix is the product of a deliberate migration: the platform commercially launched in 2011 targeting display advertising and added channels from there [24].
Market Structure
The framework's durability question leans on market structure, and the primary record here is unusually direct. The FY2025 10-K opens its competition section: "Our industry is highly competitive and fragmented. We compete with other demand-side platform providers, some of which are smaller, privately held companies and others are divisions of large, well-established companies such as Google and Amazon" [25]. The same sentence in the FY2021 10-K named "Google and Adobe" [26]. The word "fragmented" has not changed in four years; the second name has.
The scale asymmetry against those two names is the structural fact.
Sources: Alphabet FY2025 10-K, revenues by type [27]; Amazon FY2025 10-K, net sales by product and service group [28]; The Trade Desk FY2025 10-K highlights [29].
Google's advertising revenue was $294.7 billion in FY2025 [30]. Amazon's advertising services revenue was $68.6 billion, up 22.1% from $56.2 billion [31]. The Trade Desk's entire gross spend — every dollar of advertiser budget crossing the platform — is 4.5% of Google's advertising revenue and 19.5% of Amazon's. Its own revenue is 1.0% of Google's. Against a digital advertising market the company sizes at "over $700 billion" [32], $13.4 billion of gross spend is about 1.9% of the pool.
Growth rates line up the same way: Amazon's advertising business grew 22.1% in FY2025 while The Trade Desk's gross spend grew 11.2% and Q1 FY2026 revenue grew 12% [33]. One data point cuts the other way: Google Network — Alphabet's own third-party, open-internet ad arm, the pool closest to The Trade Desk's — fell from $30.36 billion to $29.79 billion in FY2025 [34]. Whatever is happening to the open internet is happening to Google there too, so the share story is not purely one of a competitor executing better on identical terrain.
Regulatory entry barriers: none. The filings disclose no licence, charter or approval requirement to operate a demand-side platform. The regulation the company faces — GDPR, the ePrivacy Directive, the EU-US Data Privacy Framework, US state privacy statutes — is disclosed as a compliance cost and a threat to the targeting data the platform depends on, not as a moat that keeps entrants out [35].
Capital intensity: low. Capital expenditure was $197 million in FY2025, 6.8% of revenue [36]; property, equipment and lease assets total $738.9 million against $2.90 billion of revenue [37]. The capital-heavy-essential pattern — where physical replacement cost deters entrants — does not describe this business. What the company does buy is hosting: $226.7 million of non-cancellable purchase obligations fall due in 2026 alone [38].
Contractual grip: thin. Master services agreements "do not contain any material commitments on behalf of clients to use our platform," run one-year auto-renewing terms, and are "terminable at any time upon 60 days' notice by either party" [39]. Concentration is rising against that backdrop: aggregated at the holding-company level, two holding companies each represented more than 10% of gross billings in 2025, against one in 2024 [40].
The ecosystem asset is real. The platform draws inventory from over 430 directly integrated ad exchanges, publishers and supply-side platforms, and integrates more than 370 third-party data vendors [41]. That breadth, plus independence from any owned inventory, is the company's stated differentiation, and it is not trivially replicated. It is also the kind of advantage the risk factors concede can be attacked by scale: competitors "may have significantly more financial, technical, marketing, and other resources," "rich first party data sets," and "in the case of 'walled garden' inventory providers, may exclusively sell their own inventory directly to advertisers, which prevents us from competing with them entirely for such inventory" [42].
Operating history: about fifteen years of commercial trading. Incorporated November 2009 [43], platform launched commercially in 2011 [44], publicly listed since 2016 [45]. The market itself is younger still: the FY2025 risk factors call programmatic ad buying "a relatively new market" whose clients "may not shift to programmatic ad buying from other buying methods as quickly as we expect" [46].
The evidence assembled here — a self-described fragmented industry, no regulatory barrier, low capital intensity, 60-day cancellable contracts, and roughly fifteen years of commercial history — is the raw material the Durability tab weighs against the framework's monopoly-duopoly-oligopoly standard. The counterweights are equally on the record: a 430-supplier integration base, structurally rising CTV share, 21.6% take rate expansion in the most recent year, and revenue that has compounded every year since 2016.
First-Pass Exclusion Screen
Automotive OEM (X1) — clean. The Trade Desk is an advertising-technology company with one operating segment — the advertising technology platform — and no manufacturing operations of any kind [47]. Automotive appears in the record only as an advertiser vertical: management called it "an area of strength overall, though we believe this business could be growing faster absent the impact of increased tariffs on the industry" [48]. No exclusion.
Consensus-saturated darling (X4) — was one, is not one now. Three tests, run on current data.
Source: derived from closing prices of 24 July 2026 and latest reported fiscal-year revenue for each company, per company filings and price data, as reported. TTD peak uses the 4 December 2024 close of $139.51 on FY2024 shares outstanding against FY2024 revenue.
On multiple-to-sales: at the December 4, 2024 peak close of $139.51, market capitalisation was $70.0 billion against FY2024 revenue of $2.44 billion — 28.6 times sales. At the July 24, 2026 close it is 2.95 times FY2025 revenue. The company now trades between Viant Technology, the closest listed pure-play independent demand-side platform, at 2.08 times sales, and Amazon at 3.51 times. Alphabet, Amazon and Adobe are not business-model matches — each runs the advertising platform as one division of a much larger enterprise — so the honest comparison in this set is Viant, and against Viant the premium is 42%.
On coverage tone: 36 published ratings split 2 strong buy, 11 buy, 18 hold, 4 sell and 1 strong sell, with a mean target price of $24.32. In the trailing 30 days, 19 to 20 FY2026 and FY2027 EPS estimates were revised down against one or two revised up. Independent reporting through 2026 records downgrades from Wells Fargo, William Blair and Arete on market-share concerns, with buy-side channel checks pointing to share loss to Amazon's DSP. This is a divided-to-negative sell side, not a consensus that already owns the story.
On chart shape: the stock ran from a $3.01 split-adjusted close on its first trading day in September 2016 to $139.51 in December 2024 — the bottom-left-to-top-right shape the exclusion targets — and then fell 88.0% to a $16.79 trough on July 23, 2026. The darling chart exists in the history; it is not the chart today.
Source: closing prices as reported in company price data; the peak, trough and 88.0% drawdown are the deterministic feature file's own values (fit_features.capitulation_gauge.drawdown).
The exclusion does not bite at this price. What survives it is a residual observation rather than a screen result: a business that carried 28.6 times sales nineteen months ago still carries 2.95 times sales while growing 12%, and the reason it is cheap is an active share-loss narrative, not investor indifference. The Dislocation and Damage Math tabs carry that question.
China exposure (S1) — immaterial as disclosed, and not separately quantified. The company discloses revenue in two buckets only, United States and International, with International at $419.6 million, or 14.5% of FY2025 revenue [49]. International property, equipment and lease assets are $86.6 million, 11.7% of the $738.9 million total [50]. China is named twice in the FY2025 filing, both times inside a list of markets: in the MD&A, "the U.K., Germany, France, China, Japan, India and Australia" are markets management believes "offer opportunities for growth" [51], and the Item 1 growth strategy names the same list as markets that "may represent substantial growth opportunities" and where the company is "investing in developing our business" [52]. No China revenue, asset, or headcount figure is disclosed anywhere in the corpus, and no China-specific risk factor appears in the FY2025 10-K. The ceiling implied by the disclosure is 14.5% of revenue; the realistic figure is a fraction of that, since the same 14.5% covers the whole of EMEA and APAC. As a listing matter the company is not a Chinese issuer and holds no Chinese ADR structure. Recorded as a sensitivity that the record cannot size below the 14.5% ceiling, not as an exclusion.
Promotional-CEO conduct and structural-decline evidence sit with Self-Help and Durability. Two facts surfaced here that those tabs will want: the FY2025 risk factors state that future success depends on the continuing efforts of key employees "including Jeff T. Green," the co-founder and CEO [53]; and the Q1 FY2026 call was hosted by an Interim Chief Financial Officer and Chief Accounting Officer [54].
Limitations of This Tab
The company reports one segment, so no divisional economics can be built from the filings. Channel mix is disclosed only as approximate percentages on earnings calls, never in the 10-K, so the CTV share cannot be tied to a filed number. Market-share estimates for the demand-side-platform market are not present in the corpus; the share statements above are ratios of disclosed revenue and gross spend against the company's own $700 billion market sizing, not third-party share data. Two of the six indexed peers, Criteo and Nexxen, carry no financial data in this run, so the multiple comparison rests on four names.
What happened to the price
The Trade Desk fell 87.97% from a $139.51 close on 4 December 2024 to $16.79 on 23 July 2026, and last traded at $17.29. Two dated triggers carry most of it: the Q4 2024 revenue miss reported 12 February 2025 (next day, minus 32.98%) and the Q2 2025 guidance reset reported 7 August 2025 (next day, minus 38.61%, on 36.1 times normal volume). Traded volume peaked at 8.89 times the pre-peak median in March 2026. Reported earnings per share never declined.
The drawdown quantified
Peak close — 4 Dec 2024
Trough close — 23 Jul 2026
Latest close — 24 Jul 2026
Peak to trough
Days, peak to trough
Peak volume multiple
Source: fit_features.capitulation_gauge, derived from the daily price and volume history [1]; peak, trough, current, depth and elapsed days are the feature file's figures as generated on 25 July 2026.
Against the peak, the latest close is 87.61% lower. Market capitalisation went from roughly $70.0 billion — $139.51 on the 501.9 million shares reported for FY2024 — to $8.53 billion at $17.29 on 493.6 million shares. On revenue, the peak valuation was 28.6 times FY2024 revenue of $2,445 million [2]; the current one is 2.95 times FY2025 revenue of $2,896 million [3]. A multiple that starts at 28.6 times sales is the framework's darling-multiple exclusion pattern, and it is the arithmetic reason a fall of this size is possible without an earnings decline.
Source: month-end closes from the company's daily price history; the July 2026 point is the 24 July close. Peak and trough dates match fit_features.capitulation_gauge.drawdown.
The legs
The fall is four segments over twenty months, not one moment.
Source: closes from the company's daily price history; drivers dated to the filings and news items cited below.
The first segment matters for classification. Between the 4 December 2024 peak and the 12 February 2025 print, the stock lost 12.39% with no dated company event and monthly average volume at 1.2 times the pre-peak median — drift, on the framework's own definition, not the moment.
The trigger
12 February 2025 — the first miss. The Q4 2024 release put quarterly revenue at $741 million, up 22%, against a consensus of $759.6 million: a shortfall of 2.44%. Full-year revenue was $2,445 million, up 26%, on $12 billion of platform spend. Jeff Green's own line in the release: the company was "disappointed that we fell short of our own expectations in the fourth quarter" [4]. Guidance for Q1 2025 was set at "at least $575 million" [5] — 17% growth on the $491 million booked in Q1 2024, against the 26% just delivered for the full year. The next session the stock closed at $81.92, down 32.98%, on 56.0 million shares, 19.2 times the pre-peak median daily volume.
7 August 2025 — the guidance reset. Q2 2025 revenue was $694 million, up 19% [6], a beat of 1.17% against consensus. The Q3 guide was "at least $717 million" [7], 14% on the $628 million booked in Q3 2024. The same evening the company announced that Laura Schenkein would transition out of the CFO role after roughly twelve years, with board member Alex Kayyal replacing her effective 21 August [8]. The next session the stock closed at $54.23, down 38.61% on 105.4 million shares — 36.1 times the pre-peak median, and the largest one-day decline in the company's history [9]. Contemporaneous coverage attributed the move to the guidance, the CFO departure and Amazon's demand-side platform, which the FY2025 10-K names alongside Google as a division of a "large, well-established" competitor [10].
The guided-growth ladder. Every subsequent print stepped the guided growth rate down again, and the steps were delivered, not merely feared.
Sources: Q4 2024 release, at least $575 million for Q1 2025 [11]; Q2 2025 release, at least $717 million for Q3 2025 [12]; Q4 2025 call, at least $678 million for Q1 2026 [13]; Q1 2026 call, at least $750 million for Q2 2026 [14]. Prior-year quarterly revenue from the company's reported results.
The 2026 events. On 26 January 2026 the company announced that Chief Accounting Officer Tahnil Davis would step in as interim CFO effective 24 January, succeeding Alex Kayyal five months into the job, and reaffirmed Q4 revenue of at least $840 million [15]; contemporaneous trade reporting described Kayyal's employment as terminated effective that date [16]. The stock fell 7.5% that day. FY2025 closed at $2.9 billion of revenue, up 18%, with Q4 at $847 million, up 14% [17], and Q1 2026 guided to at least $678 million, 10% growth [18]. In March 2026 two further items landed: Publicis paused client spend on the platform following an agency-commissioned audit of fee practices, resolved privately in June 2026, and on roughly 15 March the court denied the company's motion to dismiss the consolidated securities class action in full [19]. That action, brought on behalf of purchasers between 15 November 2023 and 8 August 2025, alleges misstatements about the Kokai platform [20] and includes a Section 20A insider-trading claim against the CEO, then-CFO and Chief Strategy Officer [21]. Q1 2026 revenue came in at $689 million, up 12%, with Q2 guided to at least $750 million — 8% growth [22].
The fear gauge
The measured spike multiple is 8.89 times: the maximum 20-day average volume anywhere in the peak-to-trough leg, divided by the median daily volume over the 180 calendar days before the peak (2.92 million shares). That maximum sits in the twenty sessions ending 24 March 2026, when the 20-day average ran at 26.0 million shares a day.
Source: derived from the company's daily volume history; the denominator (2.92 million shares) is the median daily volume in the 180 calendar days before the 4 December 2024 peak, matching the definition in fit_features.capitulation_gauge.volume_spike.
Three readings of the same tape, and they do not all point the same way.
Emotion-driven selling is unambiguously present. The single heaviest session was 8 August 2025 at 105.4 million shares, 36.1 times the pre-peak median. The Q4 2024 reaction day was 19.2 times. The Q4 2025 reaction day, 26 February 2026, was 18.1 times. Only one month since January 2025 — June 2025, at 2.4 times — has averaged below three times normal.
The peak-fear window, on the feature's own measure, was late February to late March 2026, when the stock traded between $22.34 and $29.79 — roughly 29% to 72% above the current price. Since then the tape has been heavy but no longer accelerating: monthly averages of 5.5, 7.2 and 7.5 times normal through April, May and June 2026, and a trailing 20-day average of 4.48 times normal on the 23 July trough day itself, against 8.89 times at the March peak. The trough day traded 17.2 million shares, 5.9 times normal — heavy, on half the March pace.
The framework's rule is peak fear, not the start of the slide. The 8.89x reading clears any reasonable capitulation bar. What it does not establish is that the current price is the exhaustion point — the heaviest selling came four months and $5.55 a share earlier.
Who was selling
Insiders were net buyers, decisively. Between 2 and 4 March 2026 Jeff Green bought 6,000,000 Class A shares in the open market at $23.49 to $25.08, for $148.1 million — a holding built from zero across four sessions. Total insider open-market sales since the peak were $10.5 million across eight transactions, of which $4.66 million was director Kathryn Falberg selling into the 5 March spike at $30.45 and $30.48 [23]. The purchase was disclosed after the close on 4 March; the next session the stock rose 18.36% to $29.79 on 82.5 million shares, 28.2 times normal. That rally did not hold — the stock was back at $25.07 by 17 March. Green's beneficial ownership rose from 9.7% (November 2024) to 11.3% (May 2026) [24].
No forced index seller is evident in the record. The index event in this window ran the other way: TTD replaced ANSYS in the S&P 500 effective 18 July 2025, and the shares jumped about 11.5% on the announcement [25] — index demand arrived at $80, roughly 4.6 times the current price. The corpus contains no deletion notice. At an $8.53 billion market capitalisation the company now sits far below the index's typical inclusion threshold, so a future deletion is a live possibility, but nothing in the filings or news dates one.
Passive holders added through the fall. State Street's disclosed stake went 5.0% (November 2025) to 7.1% (February 2026) to 10.4% (April 2026); Vanguard Capital Management and Vanguard Portfolio Management filed new 13Gs in late April 2026 at 7.62% and 5.21%; BlackRock moved from 6.6% (February 2025) to 7.6% (October 2025) [26].
The company itself was a buyer. $261 million of Class A stock was repurchased in Q2 2025 alone [27], $1,380 million across FY2025, and $164 million in Q1 2026 [28]. In February 2026 the board added $350 million to the authorisation, bringing the total available for future repurchases to $500 million [29]. Share count went from 501.9 million (FY2024) to 493.6 million (FY2025); the execution record is examined in Self-Help.
The identified marginal seller in the final leg is a short, not an exhausted holder. No reported short-interest series is available in this run — FINRA returned no position rows and data/short_interest/latest.json is unavailable, so the numbers below come from public short-interest reporting located by web search rather than from the corpus, and carry that lower standard. On that basis, shares sold short ran at roughly 43.95 million (about 10.0% of float) in early February 2026 and roughly 76.79 million (about 21.1% of float) in the most recent July 2026 report — an increase of about three-quarters over the five months in which the stock fell from $27 to $17. That is the opposite of a position being covered into a washout.
The sell side had not capitulated. Consensus at 25 July 2026 carried a mean target of $24.32 across 30 estimates, with 11 buy, 2 outperform, 19 hold, 3 sell and 1 underperform — a target 41% above the last close.
Estimates against price
Consensus revision history in this run reaches back 180 days, to 26 January 2026. Over that window the price fell roughly four times as far as the near-year earnings line and about twice as far as the far-year one.
Source: consensus revision history from the consensus estimates feed (data/sp/estimates.json, momentum series, 180-day and current snapshots); prices are closes from the daily price history.
Across the whole drawdown, the earnings line never turned down at all. Non-GAAP diluted EPS was $1.66 in FY2024 [30] and $1.77 actual in FY2025, with consensus at $1.85 for FY2026, $2.15 for FY2027 and $2.24 for FY2028. Revenue ran $2,445 million, $2,896 million actual, and $3,177 million consensus for FY2026.
Sources: FY2024 non-GAAP diluted EPS of $1.66 from the Q4 2024 release [31]; FY2025 actual and FY2026–FY2028 consensus normalised EPS from the consensus estimates feed.
So the multiple did all the work. At the peak, $139.51 against FY2024 non-GAAP EPS of $1.66 is 84.0 times; $17.29 against the FY2026 consensus of $1.85 is 9.3 times, and against FY2025 actual EPS of $1.77 is 9.8 times. Market capitalisation fell about $61.5 billion while the earnings line rose in every year of the period.
Two facts cut against reading that as a finished repricing. First, the far-year estimate line is still moving: FY2028 revenue consensus is down 17.6% in six months and FY2028 EPS down 23.3%, with no sign of settling. Second, the revision breadth is one-sided — 20 of 22 contributing analysts cut their FY2027 EPS estimate in the trailing 30 days, against 1 raise [32], and the 90-day-ago FY2026 and FY2027 figures of $2.0713 and $2.4004 have since fallen to $1.8517 and $2.1476, moves of 10.6% and 10.5% [33]. On the framework's timing test, the price led the cut on the near years and is still ahead of it; on the far years the cut is running and unfinished.
Consensus free cash flow over the same horizon has not been cut in absolute terms — $780.0 million for FY2026, $883.3 million for FY2027, $967.0 million for FY2028 — which on the $8.53 billion market capitalisation computes to yields of 9.1%, 10.4% and 11.3%. What those figures mean against the framework's bar belongs to Yield; what the $61.5 billion of destroyed market value implies about damage to intrinsic value belongs to Damage Math.
Limitations
No reported short-interest series was staged for this run: FINRA returned zero position rows, and data/short_interest/history.json, short_sale_volume.json, borrow_pressure.json and public_net_short_disclosures.json are all empty. The short-interest levels stated above come from public short-interest reporting located by web search and are not corpus-sourced. The dedicated web-research provider was unavailable during this run (billing error), so seller-composition evidence beyond SEC Form 4s and Schedule 13G filings is thinner than it would otherwise be. Consensus revision history reaches back only 180 days, so the estimate path across the first fourteen months of the drawdown cannot be reconstructed from this data; the reported-EPS path is used instead. No 13F holder-level turnover data was available.
Bottom line
The Trade Desk's market capitalisation fell from $70.0 billion to $8.5 billion while reported free cash flow rose from $641 million to $796 million. No near-term earnings line was cut; what was cut is the growth rate — guided quarterly revenue growth stepped from 17% to 8% over six quarters. On reported cash flow a large gap opens between price and value. On the framework's adjusted basis, which removes the $462 million of stock compensation consensus carries for 2026, the gap closes to roughly nothing.
What the price destroyed
From the 4 December 2024 close of $139.51 to $17.29 on 24 July 2026, the shares fell 87.6%, with a closing low of $16.79 the day before [1]. Applying the FY2024 and FY2025 reported share counts, market capitalisation went from $70.0 billion to $8.5 billion — $61.5 billion removed. Net cash fell over the same span from $1.92 billion to $1.41 billion, so enterprise value went from $68.1 billion to $7.13 billion, a decline of 89.5%.
The single largest day was 8 August 2025, when the shares fell 38.6% close to close on 105.4 million shares [2] — reported as the largest one-day decline in the company's public history, on the Q2 FY2025 results, the CFO's departure and Amazon DSP competition [3]. The anatomy of the fall, including the volume gauge, sits in Dislocation.
Over the same window nothing in the cash-flow statement fell. FY2025 revenue rose 18% to $2,896.3 million, net income 13% to $443.3 million, operating cash flow 34% to $992.7 million, and Adjusted EBITDA 18% to $1,196.4 million [4]. Free cash flow rose 24%, from $641.2 million to $795.7 million [5].
Sources: market capitalisation from fiscal-year-end closes and reported share counts [6][7]; free cash flow as reported, with the final point using FY2026 consensus free cash flow of $780.0 million [8][9]. Derived from reported financials and the daily price series.
At the December 2024 peak the equity was priced at 28.6 times FY2024 revenue, 69.3 times FY2024 Adjusted EBITDA and 109 times FY2024 free cash flow. At $17.29 it stands at 2.95 times FY2025 revenue, 5.7 times FY2026 consensus EBITDA on enterprise value, and 10.7 times FY2025 reported free cash flow. The starting point was the multiple profile the framework treats as an exclusion — a high-growth name on an extreme multiple to sales, with consensus fully invested in the story. That matters for the arithmetic below: most of the $61.5 billion was the unwinding of a price that no cash-flow path in this frame ever supported.
The near-term hit, in the company's own guidance
The trigger record here is not an earnings cut. It is a sequence of guides, each lower than the last, and each of which the company then beat.
Sources: guidance from the quarterly earnings calls — Q1 FY2025 "at least $575 million reflecting 17%" [10], Q2 FY2025 "at least $682 million, reflecting 17%" [11], Q3 FY2025 "at least $717 million, reflecting 14%" [12], Q4 FY2025 "at least $840 million" [13], Q1 FY2026 "at least $678 million, representing 10%" [14], Q2 FY2026 "at least $750 million" [15]; reported revenue per the quarterly income statement [16]. Growth rates derived.
Two facts sit inside that chart in tension. Every guide was beaten — by 7.1 points in Q1 FY2025, then 1.8, 3.1, 0.8 and 1.6 points. And the level fell anyway: the guided rate halved from 17% to 8.1%, and the beat margin narrowed to under two points. Management attributes the Q2 FY2026 step to geopolitical uncertainty, tariffs and consumer softness in CPG and automotive [17], having earlier quantified the vertical drag: CPG and automotive are "roughly a quarter of our business," and "we would have been at least 5% higher in growth rate if you don't include those categories" [18].
Margin guidance did not move with revenue. Q2 FY2026 Adjusted EBITDA is guided to approximately $260 million on at least $750 million of revenue, and the full year to "at least 40%, approximately in line with 2025" [19].
Consensus for the near term is not a cut in level terms either. FY2026 consensus revenue of $3,177.1 million is 9.7% above FY2025 actual revenue [20], and FY2026 consensus normalised EPS of $1.85 [21] is 4.6% above the $1.77 of normalised earnings the company delivered in FY2025 on the same consensus basis. The canonical pattern the framework hunts — a two-thirds earnings cut with the stock anchored to it — is not what happened here. The numerator of this tab is a growth-rate reset, not an earnings reset.
Estimates and price, on matched windows
The vendor revision history reaches back 180 days, to 26 January 2026. It does not cover the February 2025 or August 2025 triggers, so the guidance sequence above is the only complete before-and-after record for those. Within the window the record does cover, both series can be read side by side.
Sources: the 90-day consensus history in the estimates document dated 25 July 2026, with the 180-day points from the same feed's momentum series, which that document does not carry [22]; share price from the daily series, with 26 April falling on a weekend and the 24 April close used [23]. Percentage changes derived.
Over 180 days the price fell 48.9% against a 23.3% cut to FY2028 EPS and a 10.1% cut to FY2027 revenue — roughly two times the furthest-out earnings cut and roughly five times the FY2027 revenue cut. Over 90 days the price fell 27.9% against a 10.6% cut to FY2026 EPS and 10.5% to FY2027 EPS [24]. The revision breadth is one-sided: 19 downward against 2 upward revisions to FY2026 EPS over the trailing 30 days, and 20 down against 1 up for FY2027 [25]. The cuts are real and still one-directional; the price move is a multiple of them.
Two scenarios, with the workings
The assumptions, stated in full and applied identically to every path below:
Base-year cash flow is FY2026 consensus free cash flow of $780.0 million. The adjusted variant subtracts FY2026 consensus stock-based compensation of $462.2 million and the trailing five-year average acquisition spend of $3.5 million, giving $314.3 million. Cash flows grow at the stated rate for five years, then at a second stated rate for five years, then at 3% in perpetuity. The discount rate is 10%. There is no drawn debt, so equity value is the discounted flows plus net cash of $1,405.9 million ($878.4 million cash plus $527.5 million short-term investments at 31 March 2026), divided by 493.6 million shares.
The three growth paths: the pre-event curve at 18% then 10%, matching the 18.5% revenue growth actually delivered in FY2025; temporary at 14% then 8%, the growth rate the company was guiding to before the Q1 FY2026 step-down; permanent at 9% then 6%, roughly the FY2026 and FY2027 consensus revenue slope carried forward and fading.
Source: derived. Base free cash flow and stock compensation are consensus means from the estimates feed dated 25 July 2026, as reported — that feed's free-cash-flow and stock-compensation lines are not carried in the estimates document in this corpus; stock compensation of $490.6 million and acquisition spend of $4.4 million from the FY2025 cash-flow statement [26]; net cash and share count as stated above.
The NPV destroyed by the growth reset, measured as pre-event curve less each alternative: $5.4 billion (19%) if the reset is temporary, $10.4 billion (37%) if permanent, on the reported basis. On the adjusted basis the same reset costs $2.2 billion (18%) and $4.2 billion (35%).
A reverse reading of the same frame is more direct. Today's $7.13 billion enterprise value against FY2026 consensus free cash flow of $780.0 million implies free cash flow declining 3.6% a year for ten years and then growing 3% forever, at a 10% discount rate. At 9% the implied path is minus 5.4%; at 11%, minus 1.9%. On the adjusted base of $314.3 million the same exercise implies growth of 8.8% a year at a 10% discount rate — approximately the consensus revenue slope.
The gap, and where it goes
Price destroyed: $61.5 billion of market capitalisation. Plausible NPV destroyed by the growth reset, on the trial's permanent reading: $10.4 billion on reported cash flow, $4.2 billion adjusted. The residual — $51.1 billion, or $57.3 billion adjusted — is not value that a cash-flow scenario says was destroyed. The December 2024 market capitalisation of $70.0 billion was 2.5 times the pre-event-curve DCF value on reported cash flow and 5.8 times it on the adjusted basis. The peak was not a value anchor at any growth path in this frame, so measuring the gap from the peak overstates it.
Measured from the frame rather than from the peak, the answer splits on one accounting choice:
On reported free cash flow, $17.29 sits 52% below the permanent-scenario value of $35.76 and 62% below the temporary-scenario value of $45.96. On the framework's adjusted free cash flow, which subtracts the $462.2 million of stock-based compensation consensus carries for FY2026, $17.29 sits 7% above the permanent-scenario value of $16.11 and 15% below the temporary-scenario value of $20.22.
Stock compensation has run between $490.6 million and $498.6 million every year since FY2022 [27] against reported free cash flow that first passed $500 million in FY2023 [28]. It is 62% of FY2025 reported free cash flow, and it is not a rounding item: $1,380.4 million of FY2025 buybacks retired a net 8.4 million shares, from 501.9 million to 493.6 million [29][30]. The adjusted yield computation and its position against the framework's reference lines are worked in Yield; the buyback mechanics are in Self-Help.
So the damage gap is real on the reported measure and substantially absent on the measure this framework actually uses. That is a statement about the cash the business keeps for shareholders, not about the diagnosis — which is the trial's to decide.
The trial: temporary or permanent
Two independent briefs argued the question from the same corpus, and three blind judges ruled.
The case for temporary, at its strongest. Every absolute earning-power line rose through the drawdown: FY2025 revenue +18%, Adjusted EBITDA +18% to $1,196.4 million, operating cash flow +34% [31], GAAP operating income +38% to $589.3 million [32], free cash flow +24% to $795.7 million [33]. The three drags are dated and quantified: a political comp that took roughly five points off Q4 FY2025 growth — "excluding political spend related to last year's U.S. elections, revenue increased approximately 19%" [34]; a tariff-driven CPG and automotive shock worth "at least 5%" of growth in categories that are "roughly a quarter of our business" [35]; and a Publicis spend pause from March 2026 that a private settlement resolved on 12 June 2026 [36]. The balance sheet carries no drawn debt, $1.41 billion of cash and short-term investments, and a $750 million revolver signed 14 April 2026 running to 2031 and undrawn [37][38]. Forward commitments accelerated while revenue decelerated: total joint business plan count grew 55% year over year in Q1 FY2026, with 45 signed in March alone [39]. And the founder-CEO bought 6,000,000 Class A shares in the open market over 2–4 March 2026 for $148,101,266, including 2,314,304 shares at $25.08 on 4 March [40].
The case for permanent, at its strongest. The growth rate has stepped down four consecutive times through a completed reorganisation and a recovery quarter: 25.6% in FY2024, 18.5% in FY2025, 12% in Q1 FY2026, and 8.1% implied by the Q2 guide against Q2 FY2025 revenue of $694.0 million [41][42][43]. Management conceded the first break was internal — "we missed the expectations we set, and it was our fault," the first miss in 33 public-company quarters [44]. Forward expectations remain one-directional after the Publicis resolution, with 19 and 20 downward revisions [45]. The revenue base is contestable by construction: client agreements "do not contain any material commitments," are terminable on 60 days' notice, and two holding companies each represented more than 10% of 2025 gross billings [46], with "limited cost and difficulty to moving their media spend to our competitors" [47]. And a vertically integrated rival arrived in the largest channel: Amazon disclosed "trillions of proprietary browsing, shopping, and streaming signals" and access to Roku's "80 million connected TV households — the largest authenticated connected TV footprint in the U.S. — exclusively through Amazon DSP" [48].
The ruling. The judges put the probability that the impairment is temporary at 0.41, with individual readings of 0.34, 0.41 and 0.64 — a spread of 0.30. The ruling is recorded as contested, and it is not order-stable: the one judge who read the temporary brief first came out at 0.34, while the two who read the permanent brief first averaged 0.525, a gap of 0.185. Both readings therefore have to be carried. The 0.64 seat discredited the permanent brief's one attempt to show declining earning power — Q1 FY2026 net income of $40.0 million against $50.7 million — on the ground that pretax income rose and operating income rose 22%, making the decline a tax-rate artifact. The 0.34 seat's decisive point was that FY2025 revenue grew 18% on gross spend of only 11% [49] — growth came from take rate, and the Publicis fee audit put take rate in play. This tab does not adjudicate between them; the probability the report carries is the trial's.
Which line broke
The take-rate observation is checkable in the filings. Revenue divided by gross spend was 20.30% in FY2024 and 21.62% in FY2025 — 132 basis points of expansion on 11% platform-spend growth [50]. Roughly seven of the 18 points of FY2025 revenue growth came from price rather than volume.
The consensus driver detail says something the trial briefs did not reach: the line analysts marked down is not connected television.
Source: consensus driver detail from the estimates feed dated 25 July 2026; channel splits are carried by 12 to 15 contributing brokers against 22 for total gross spend. Growth rates derived from the consensus means, as reported — the channel driver lines are not carried in the estimates document in this corpus; the feed's gross-spend levels are not reconcilable to the company's reported gross spend, so only rates and shares are used.
Consensus has connected television and video growing 10.4%, 13.9% and 11.8% over the next three years, with its share of platform spend rising from 49.1% to 54.7%. Mobile in-app and web contracts 9.7% in FY2026 and falls from 34.2% to 26.1% of spend. Take rate is modelled up, from 20.5% to 21.4% and holding above 21% through FY2028. The company's own disclosure runs the same way: connected television "grew at a faster rate than the overall business throughout 2025, including during Q4" [51], and video moved from about 50% of the business in Q4 FY2025 to a low-50s percentage in Q1 FY2026 while mobile fell from around 30% to a high-28s percentage [52].
Two consequences follow, one for each side. The mechanism the permanent case leans on — Amazon taking connected-television share, and the Publicis audit repricing the take rate — is absent from the numbers analysts are currently publishing. If that case is right, the estimates are still too high and the permanent-scenario value above is generous. The mechanism the temporary case leans on — a cyclical vertical shock that reprices on the advertisers' own calendar — is consistent with a mobile and display contraction inside a still-growing connected-television book, and the company has flagged that pricing competition and mix can make revenue grow more slowly than platform spend [53]. Neither reading is settled by the driver data; it locates where the settlement will show up.
What would change this read
The first observable test is Q2 FY2026, reported 6 August 2026: revenue against the $750 million guide and the full-year margin against the 40% floor. The second is Q3 FY2026 in November — the first quarter with Publicis spend restored, the tariff comp lapped and the midterm political comp present. Growth failing to clear roughly 10% there would convert three dated drags into a run rate and validate the consensus curve; growth of 13% or better would establish the 8.1% guide as pause-distorted. The third is the take rate: revenue over gross spend falling below 20% in FY2026, from 21.62%, would show the fee model was repriced rather than temporarily disputed. Timing and catalysts are worked in Clock; the year-10 question the growth reset bears on is in Durability.
The arithmetic on this page would change materially if stock-based compensation fell durably below roughly $350 million a year while free cash flow held, which would move the adjusted base enough to reopen a gap under the permanent scenario. Consensus does not model that: FY2026 stock compensation is carried at $462.2 million and FY2027 at $485.2 million.
The adjusted-yield arithmetic
The Trade Desk generated $795.7 million of reported free cash flow in FY2025, which is a 9.3% yield on today's $8.5 billion market capitalisation. Subtracting $490.6 million of stock-based compensation and the five-year average of acquisition spend leaves $301.6 million — a 3.5% adjusted yield [1]. The balance sheet carries no drawn debt and $1.3 billion of net cash [2][3], which selects the framework's 8–9% fortress reference line. FY2025 sits 447 basis points below its low end.
What the adjustment removes
The framework's yield basis is adjusted free cash flow: reported FCF, minus stock-based compensation, minus the trailing five-year average of acquisition spend. For The Trade Desk the middle term does nearly all the work. Stock-based compensation has run between $490 million and $499 million in every year since FY2022 [4][5], against reported free cash flow that only reached $500 million in FY2023. From FY2021 through FY2023 the company's non-cash equity expense exceeded or roughly matched everything the business converted to cash after capital expenditure.
Acquisition spend is close to irrelevant here: two transactions in seven years, $13.3 million in FY2021 [6] and $4.4 million of cash in FY2025 [7], for a trailing five-year average of $3.5 million against the FY2025 base. The FY2025 deal also involved $10.3 million of Class A stock issued as consideration; folding that in would lift the five-year average to $5.6 million and reduce adjusted FCF by a further $2.1 million, which does not move any conclusion on this page.
Adjusted FCF = reported FCF − stock-based compensation − 5-yr average acquisition spend; derived from the filed cash-flow statements. Sources: FY2025 Form 10-K, Consolidated Statements of Cash Flows [8]; FY2022 Form 10-K [9]; FY2021 Form 10-K [10]; Q1 FY2026 Form 10-Q [11].
Reported free cash flow here is operating cash flow less purchases of property and equipment, matching the deterministic feature definition. The filings also show capitalised software development costs of $12.8 million in FY2025 [12]; treating that as capital spending would reduce every figure in the table by roughly $8–13 million and lower the FY2025 adjusted yield by 15 basis points.
The deterministic feature file returns adjusted FCF as not-computable for this company — its structured cash-flow feed carries no stock-based compensation field for any year from FY2016 to FY2025. The figures above are therefore computed on this page directly from the filed cash-flow statements, with each year's SBC anchored to the 10-K page that reports it. The balance-sheet class and the yield baseline below are computed the same way, for the same reason, and each is recorded as a data gap rather than a silent substitution.
The yield, three ways
Adjusted Yield, FY2025
Adjusted Yield, TTM
Adjusted Yield, 3-Yr Avg
Reported FCF Yield, FY2025
All four computed on the market capitalisation of $8,533 million (493.6 million shares at the $17.29 close of 24 July 2026). Numerators derived from the filed cash-flow statements [13][14].
The three-year average, $167.6 million of adjusted FCF across FY2023–FY2025, gives 1.96%. The gap between that and the 3.53% current-year reading is not a valuation move — it is the improvement in the underlying number, which rose from $57.3 million to $301.6 million over those three years while stock-based compensation stayed flat.
The trailing-twelve-month figure is the freshest reading. Q1 FY2026 produced $391.8 million of operating cash flow against $112.7 million of property and equipment purchases, with stock-based compensation of $109.0 million versus $128.3 million a year earlier [15]. Rolling that quarter in and the year-ago quarter out gives $842.5 million of reported FCF, $471.4 million of SBC and $367.5 million adjusted — 4.31% on today's market capitalisation.
The company's own yield baseline
Measuring each fiscal year's adjusted FCF against that year's own market capitalisation isolates how the yield has actually behaved through the company's history rather than restating everything at today's price.
Each year's adjusted and reported FCF divided by that year's share count times the last close on or before fiscal year-end; the "Today" point uses the 24 July 2026 close. Derived from the filed cash-flow statements [16][17][18] and daily closing prices.
The median adjusted yield across FY2019–FY2024 is 0.06%. Today's 3.53% is a jump by any threshold — roughly sixty times the historical median, and more than double it under the framework's two-times test. But the fortress signature the framework hunts is a stable mid-single-digit yield that suddenly doubles: Microsoft moving from 4% to 9% on an AI scare. The Trade Desk has no such baseline to jump from. It has never, in seven fiscal years, produced an adjusted yield above 1.7% on its own market capitalisation. The jump is real; the level it jumped to is what the reference line tests, and that level is 3.53%.
Which bar applies
Sources: FY2025 Form 10-K, Consolidated Balance Sheets [19] and Liquidity and Capital Resources [20]; Q1 FY2026 Form 10-Q, cash and short-term investments [21] and Note 6 Debt [22].
The company reports no outstanding debt balance under its revolving credit facility at either date, with $445 million of availability net of $5 million of letters of credit [23][24]. Net debt is therefore negative $1,303.1 million at FY2025 year-end. The framework's classification rule is net debt at or below zero, or net debt to EBITDA at or below 0.5 times; the first condition is met on the cash test alone, so no EBITDA denominator is needed. For completeness, company-defined Adjusted EBITDA was $1,196.4 million in FY2025 [25] and EBITDA on a GAAP build-up — net income of $443.3 million plus $115.8 million of depreciation and amortisation plus $215.5 million of tax provision less $68.7 million of net interest income — is $705.8 million. Net debt to EBITDA is negative 1.09 times or negative 1.85 times respectively. Adding the $436.3 million of operating lease liabilities as debt [26] still leaves $866.8 million of net cash.
Balance-sheet class: fortress. Reference line: 8–9% adjusted yield.
Against that line, in plain arithmetic:
- FY2025 adjusted yield of 3.53% against the 8% low end — 447 basis points short; against the 9% high end, 547 basis points short.
- Trailing-twelve-month adjusted yield of 4.31% — 369 basis points short of 8%.
- Three-year average adjusted yield of 1.96% — 604 basis points short of 8%.
- Reported, unadjusted FY2025 FCF yield of 9.32% — 32 basis points above the 9% high end.
That last line is the point of the adjustment. On the reported number this looks like a fortress balance sheet trading at the top of its reference range. Stock-based compensation of $490.6 million removes 62% of the reported free cash flow, and the same company sits 447 basis points below the bottom of that range. The framework's own precedent for this is Accenture, which drops out of consideration once adjusted; the mechanism here is identical and larger.
Two sensitivities a reader should hold. First, the market capitalisation used throughout is the feature file's $8,533 million, built from 493.6 million shares; the FY2025 10-K cover page reports 432.9 million Class A plus 43.1 million Class B shares outstanding at 31 January 2026, or 476.0 million [27]. On the lower count the market capitalisation is $8,230 million and the FY2025 adjusted yield is 3.66% — still 434 basis points short. Second, on enterprise value net of the $1,303.1 million cash and investments, the FY2025 adjusted yield is 4.17%. Neither restatement closes half the gap.
Normalisation
The Trade Desk is not a cyclical in the sense that requires mid-cycle normalisation. Revenue has risen in every one of the ten fiscal years on record, from $202.9 million in FY2016 to $2,896.3 million in FY2025, with no decline in any year and no year of negative reported free cash flow on record. There is no depressed trough year to normalise up from and no boom year to normalise down. On the adjusted basis the record is less smooth — FY2019, FY2021 and FY2022 were negative — but those are stock-compensation effects, not demand cycles. Digital advertising is macro-sensitive, and growth has decelerated — 25.6% in FY2024, 18.5% in FY2025, and 11.8% year-over-year in Q1 FY2026 [28] — but deceleration from a high base is not cyclicality, and normalising it would mean forecasting, not averaging.
Two year-specific distortions in FY2025 do warrant naming, because both push the current adjusted-FCF figure up rather than down.
The deferred-tax drawdown. FY2025 operating cash flow included a positive $167.7 million deferred income tax adjustment, against negative $76.9 million in FY2024 — a $244.6 million swing [29]. The mechanism is visible on the balance sheet: the deferred income tax asset fell from $230.2 million to $55.7 million over the year [30]. Cash taxes paid were $150.1 million against a book provision of $215.5 million [31]. With only $55.7 million of that asset left, and the deferred income tax balance unchanged at 31 March 2026 [32], the tailwind is largely spent. Two explicit alternates: if none of the $167.7 million repeats, FY2025 adjusted FCF normalises to $133.9 million and the yield to 1.57%; if the remaining $55.7 million of the asset is drawn down over the next year and the rest does not repeat, the normalised figure is $189.6 million and 2.22%. A skeptic who believes new deferred items replenish the asset at the FY2025 rate should keep the unadjusted $301.6 million and 3.53%.
Capital expenditure. Property and equipment purchases doubled to $197.0 million in FY2025 from $98.2 million [33] and ran at $112.7 million in Q1 FY2026 alone [34]. This is a data-centre build, and consensus carries it higher again in FY2026, so it is a level shift rather than a spike to average away. Normalising capex back to the FY2023–FY2024 average of $72.5 million would add $124.5 million to FY2025 adjusted FCF and 146 basis points to the yield — an assumption the company's own spending pattern does not support, stated here so the arithmetic is visible to anyone who wants to make it.
Taking the two together and treating them symmetrically, the defensible normalised band for FY2025 adjusted FCF runs from roughly $134 million to $302 million, or 1.6% to 3.5%. Every point in that band sits below the 8% line.
The consensus check
Consensus data covers free cash flow directly, defined as cash from operations less capital expenditure — the vendor's FY2025 free-cash-flow mean of $823.0 million against the company's filed $795.7 million is consistent with that definition, and its FY2025 EBITDA mean of $1,173.3 million against company-reported Adjusted EBITDA of $1,196.4 million confirms that the street measures this business on stock-compensation-excluded metrics throughout. That matters: the consensus free-cash-flow line is the unadjusted numerator, not the framework's. The estimate set was pulled 25 July 2026, with 35 contributors on FY2026 revenue; the free-cash-flow series itself carries no analyst count, so its dispersion is not observable.
Consensus free cash flow from the vendor estimate feed, vintage 25 July 2026; all yields on the $8,533 million market capitalisation. Adjusted columns subtract stock-based compensation and $3.5 million of average acquisition spend, on the two assumptions described below.
On the unadjusted line, consensus clears the fortress bar comfortably from FY2026 onward — 9.14% next year, 10.35% the year after. That is the sell side agreeing that the cash generation is there. On the framework's basis it does not clear, and the arithmetic of why is short.
Assumption set A — stock-based compensation flat at the FY2025 level of $490.6 million. Adjusted yield reaches 3.35% in FY2026, 4.56% in FY2027, 5.54% in FY2028 and 7.08% in FY2029. It never touches 8% inside the consensus horizon.
Assumption set B — the CEO Performance Option roll-off is banked and the remainder is frozen in dollars. This is the most favourable defensible assumption. The CEO Performance Option cost $198 million in FY2023, $128 million in FY2024 and $67 million in FY2025, and had $5 million unrecognised at year-end over a 0.2-year weighted-average period [35]. The Q1 FY2026 10-Q confirms it is now finished: $5 million recognised in the quarter, against $24 million a year earlier, and fully recognised as of 31 March 2026 [36]. Stripping it out, Q1 FY2026 stock-based compensation was $104.0 million against $104.3 million in Q1 FY2025 — the underlying charge is flat year-over-year. Annualising $104.0 million gives a run-rate of $416 million from FY2027, with FY2026 at $421 million. On that path the adjusted yield reaches 4.17% in FY2026, 5.44% in FY2027, 6.42% in FY2028 and 7.95% in FY2029 — still short of 8%, four years out, on the friendliest assumption available.
The mean-reversion underwrite
Clearing the 8% line at today's market capitalisation requires $682.7 million of adjusted free cash flow. Two paths reach it, and both need something consensus does not currently carry.
Path one — a free-cash-flow beat. Holding stock-based compensation at the $416 million post-roll-off run-rate, $682.7 million of adjusted FCF requires $1,102 million of reported FCF. Consensus has $967.0 million in FY2028, so the path needs a 14% cumulative beat over three years. The company's own recent record makes that arguable: reported FCF grew from $551.5 million in FY2023 to $795.7 million in FY2025, an average of $122 million a year, and extrapolating that pace to FY2028 gives $1,162 million — above what the path requires. Consensus disagrees, carrying FY2026 FCF below FY2025 on the higher capital expenditure. The disagreement is entirely about capex and cash taxes, not about revenue.
Path two — a stock-compensation cut. Holding consensus FCF, the FY2028 line clears only if stock-based compensation falls to $280.8 million, a 43% reduction from FY2025. The filings make that close to mechanically unavailable: at 31 December 2025 the company carried $677 million of unrecognised expense on restricted stock over a 2.8-year weighted-average period [37] and $143 million on stock options over 3.0 years [38]. Those two commitments alone amortise at roughly $290 million a year before a single new grant, and the company granted 5.65 million restricted shares [39] and 2.68 million options [40] in Q1 FY2026 alone.
Probability that adjusted yield clears 8% on today's market capitalisation within three years — by FY2028: roughly 20%, with a defensible range of 10% to 30%. The basis is the joint requirement of the two conditions in path one: stock-based compensation holding flat in absolute dollars while revenue grows (the Q1 FY2026 evidence supports it, but it requires grant discipline that has not yet been tested over a full year of a depressed share price, where dollar-constant grants mean issuing far more shares), and reported free cash flow running roughly 14% above consensus by FY2028 against a rising capital-expenditure programme and a deferred-tax asset that is nearly exhausted. Assigning approximately 50% to the first and approximately 35–40% to the second gives the central estimate. What consensus would have to concede for this to become the base case is not a revenue upgrade — it is a capex plateau and a flat stock-compensation dollar line, neither of which is in the current numbers.
The alternative arithmetic route to 8% is a lower market capitalisation, which is mechanical rather than fundamental: at $3,770 million of market value, FY2025 adjusted FCF of $301.6 million yields 8%. That is 56% below today's price.
FCF-to-revenue conversion
Reported and adjusted FCF divided by revenue for each year. Revenue from the Consolidated Statements of Operations [41][42]; cash-flow components as cited above.
Reported conversion is stable: between 26.2% and 29.4% of revenue in every year from FY2021 through the trailing twelve months, with no trend in either direction. Adjusted conversion is the strongest fact on this page in the company's favour. It has improved in each of the last four years — negative 2.3% in FY2022, 2.9% in FY2023, 5.9% in FY2024, 10.4% in FY2025, 12.4% on a trailing basis — and the reason is arithmetic rather than operational: stock-based compensation has been flat at $490–499 million since FY2022 while revenue grew 84%, from $1,577.8 million to $2,896.3 million. Nothing in the conversion trend undercuts the yield case; the trend is the strongest argument that the yield case might eventually arrive. The question the reference line asks is whether it arrives inside the framework's window, and on both consensus and the company's own three-year pace it does not.
The share-count mechanics that determine whether this cash reaches per-share value — $1,380.4 million of repurchases in FY2025 against a share count that has risen over five years — sit in Self-Help. The $8.5 billion market capitalisation that produces even a 3.5% adjusted yield is itself below the framework's universe floor, which is treated in Business.
Durability
The Trade Desk has grown revenue in each of its ten reported fiscal years, so the framework's structural-decline disqualifier is not triggered. But none of the five sources the framework accepts as conviction — market structure, regulatory barriers, capital intensity, essentialness, operating history — applies here on the company's own filed description of itself. What protects year-10 cash flow is execution and a 21.6% take rate; a top-two customer contested the second in 2026, and Amazon is contesting the first.
The conviction sources, one by one
The framework grants conviction from five specific places. Each is graded below against The Trade Desk's own filings rather than against the company's reputation.
Sources: FY2025 Annual Report (Form 10-K) — Our Competition and Our Industry [1], [2]; Our Clients [3]; Executive Summary [4]; consolidated balance sheet [5]; risk factors [6]; Note 1 Nature of Operations [7]; 2025 capex, Consolidated Statements of Cash Flows [8]; cookie and identifier restrictions [9] and competitors holding first-party data and walled-garden inventory [10]; NASDAQ listing date [11].
Two of those entries deserve their exact wording, because the company chose it. On competition: "Our industry is highly competitive and fragmented. We compete with other demand-side platform providers, some of which are smaller, privately held companies and others are divisions of large, well-established companies such as Google and Amazon" [12]. On switching costs: client master services agreements "do not contain any material commitments on behalf of clients" and are "terminable at any time upon 60 days' notice by either party" [13], with "limited cost and difficulty to moving their media spend to our competitors" [14].
What the company does have is real and should not be understated: 430 directly integrated exchanges, publishers and supply-side platforms and more than 370 third-party data vendors [15], a retail-data marketplace management says covers more than 80% of sales from top U.S. retailers against Amazon's under-15% share of U.S. retail spend [16], a client retention rate the FY2024 filing puts above 95% in each of the preceding eleven years [17], and ten straight years of revenue growth. That is a strong competitive position built by operating well. The framework's own construction is that operating well is not a year-10 protection, because it must be re-earned every year against whoever shows up.
The threats, quantified
The take rate is doing the growing
Revenue grew 18% in 2025. Gross spend — the actual volume of advertiser money routed through the platform — grew 11% [18]. The gap is take rate.
Take rate = revenue divided by gross spend; derived from figures as filed. Sources: FY2025 Form 10-K, Executive Summary [19]; FY2024 Form 10-K, Executive Summary [20]; FY2023 Form 10-K, Executive Summary [21].
Held at the 2024 take rate of 20.30%, 2025 gross spend of $13,395m would have produced revenue of $2,719m. Reported revenue was $2,896m. So $177m of the $451m revenue increase — 39% of it — came from charging more per dollar routed, not from routing more dollars [22].
The company's own risk factor names the long-run direction of that variable, and it is the other way: "As the market for programmatic buying for advertising matures, growth in spend may outpace growth in our revenue due to a number of factors, including pricing competition, volume discounts and shifts in media, client and channel mix" [23]. Viant's chief executive, describing the same market from inside it, put a number on the competing offer: Amazon "are really good at subsidizing businesses in the near term — you are seeing that with their 1% fees that they have been out in the marketplace" [24].
The sensitivity is arithmetic. On 2025 gross spend, each 100 basis points of take rate is $134m of revenue. Reverting to the 20.30% of 2022–2024 costs $177m of revenue; at the FY2025 adjusted-EBITDA margin of 41.3% ($1,196m on $2,896m) [25], that is roughly $73m of cash profit — about a quarter of 2025 adjusted free cash flow. A move to 15% takes $887m of revenue, nearly triple adjusted free cash flow. Nothing structural stops that move; the 60-day termination right is on the client's side of the contract.
Amazon: two incompatible descriptions of the same market
In November 2025 the chief executive told analysts that roughly 97% to 99% of Amazon's advertising effort is monetising owned-and-operated inventory, that Amazon's demand-side platform is "definitely a lower priority," and: "Looking ahead to the next ten years, I doubt Amazon will develop a DSP as we understand it" [26].
In the same quarter, Amazon's chief executive told his own analysts the opposite: "We have addressed customer feedback over the past 20 months and closed key gaps, making our DSP fully featured. Our partnership with Roku provides the largest connected TV presence in the U.S. Furthermore, we have added integration opportunities with ad inventory from Netflix, Spotify, and SiriusXM for our DSP customers" [27]. One quarter earlier Amazon described the Roku arrangement in terms that matter commercially: advertiser access to "80 million connected TV households — the largest authenticated connected TV footprint in the U.S. — exclusively through Amazon DSP," alongside an integration with Disney's real-time ad exchange [28].
The resource asymmetry behind that is filed: Amazon's advertising services revenue was $68.6bn in 2025, up from $56.2bn and $46.9bn in the two prior years [29]. The Trade Desk's entire revenue is $2.9bn and its entire gross spend $13.4bn. A competitor 24 times larger on the revenue line can price a demand-side platform at 1% for as long as it wants to.
Connected television and other video was a low-50s percentage of revenue in Q1 2026 [30], roughly $1.5bn annualised. If exclusive or owned-platform supply paths of the Roku kind take a quarter of that pool over ten years, that is about $375m of revenue and, at the 41.3% margin, roughly $155m of cash profit — more than half of 2025 adjusted free cash flow. This is a scenario, not a forecast; what makes it a live one rather than a hypothetical is that the first such arrangement has already been announced by the counterparty, in its own words, with the word "exclusively" in it.
Two customers, one withdrawn recommendation
If client relationships were aggregated at the holding-company level, two holding companies would each have represented more than 10% of gross billings in 2025, against one in 2024 [31]. At year-end 2025 two clients each accounted for at least 10% and together 30% of consolidated receivables [32]. Publicis Groupe was named in the FY2023 filing as the one holding company above that 10% line in both 2023 and 2022 [33].
That relationship broke in public. Ad Age reported in mid-March 2026, and Digiday and MediaPost followed, that Publicis stopped recommending The Trade Desk to clients after an audit alleging discrepancies in fees, consent and cost transparency; the two sides issued a joint statement in mid-June 2026 saying the matter was settled and Publicis was recommending the platform again, without disclosing terms. Asked about it on the Q1 2026 call, the chief executive said only that "our negotiations are ongoing" and that the coverage had been "overdramatized" [34]. Three months of a top-two customer's recommendation withdrawn, over fee transparency, is the concentration risk and the take-rate risk arriving as the same event. Losing one such holding company would remove at least 10% of gross billings — using 2025 gross spend of $13.4bn as the proxy for gross billings, at least $1.34bn of spend and roughly $290m of revenue at the 21.6% take rate, about $120m of cash profit at the FY2025 margin, or 40% of adjusted free cash flow.
The open-internet pool
Google Network revenue — Google's advertising on third-party publisher properties, structurally the same pool The Trade Desk buys in — was $31.31bn in 2023, $30.36bn in 2024 and $29.79bn in 2025 [35]. Three consecutive annual declines, 4.9% cumulatively, while Google's total advertising grew. That series does not separate a shrinking open web from Google losing share of it, and The Trade Desk's own gross spend grew across the same period — so it is a caution, not a finding. It is the only recurring quantitative disclosure in the peer set that measures the open web directly, and it points down.
The disqualifier check
The framework's one automatic exclusion on this pillar is revenue declining at a high-single-digit rate for three consecutive fiscal years after long existence.
Source: fit_features.revenue_trajectory, derived from company filings as reported; FY2025 figure also filed at FY2025 Form 10-K, Executive Summary [36].
Source: fit_features.revenue_trajectory, year-on-year percentages as computed in the deterministic feature file from filed revenue.
fit_features.revenue_trajectory records consecutive_decline_years: 0 and three_year_hsd_decline: false. Revenue has risen in every one of the ten fiscal years on record, a compound rate of 34.4% from $203m to $2,896m. The disqualifier is not triggered, and the structural-decline exclusion is checked and absent at the company level.
What the same series shows is a decelerating slope: 25.6% in 2024, 18.5% in 2025, 11.8% in Q1 2026 ($689m against $616m), and a Q2 2026 guide of "at least $750m" against $694m a year earlier — 8.1% if met at the floor [37]. Deceleration is not decline, and the two should not be blurred. Growth of 8% is still growth.
FCF consistency
fit_features.fcf_stability returns an empty series. The feature file records the reason: adjusted free cash flow is not_computable because stock-based compensation is absent from the structured cash-flow feed for every year from FY2016 to FY2025, so no five consecutive adjusted years exist. The profile's rolling five-year average adjusted-FCF series therefore cannot be reported from the deterministic file, and that is recorded as a data gap.
The filings themselves do disclose both components. The series below is built from the cash-flow statements as filed, using the profile's definition, and is shown as filed arithmetic rather than as a substitute for the feature file.
Adjusted FCF = reported free cash flow minus stock-based compensation minus the trailing five-year average of acquisition spend; components as filed. Sources: FY2025 Form 10-K, Consolidated Statements of Cash Flows [38]; FY2023 Form 10-K [39]; FY2021 Form 10-K [40].
The acquisition leg is negligible and that is worth stating precisely: the only two purchases in the record are $13.3m in 2021 [41] and $4.4m in 2025 [42], a five-year average of $3.5m in the FY2025 window. Stock compensation is the whole of the adjustment: $490.6m in 2025 against reported free cash flow of $795.7m, so 62% of the reported cash flow is paid in shares.
Rolling five-year average of the adjusted-FCF series above; derived from filed cash-flow statements [43], [44], [45]. Only three complete windows exist; stock compensation before FY2019 is not in this corpus.
Read against the framework's test — is the rolling five-year average stable, or genuinely unpredictable — the series is neither volatile nor cyclical. It rises monotonically, $33m to $73m to $90m, and the two negative years, 2021 and 2022, are not an underwriting cycle. They are the years the stock-compensation line stepped from $112m to $337m to $499m. That is a discretionary compensation decision, not a business-model rhythm with a five-to-eight-year cadence, so the framework's tolerance for periodic negative episodes does not apply. Since 2022 the line has been flat in dollars — $499m, $492m, $495m, $491m — while revenue grew 84%, taking stock compensation from 31.6% of revenue to 16.9%. That flattening, not cash-flow growth, is what turned adjusted free cash flow positive.
The base is also small and young. Three complete windows is a short record on which to call anything stable, and the latest window's $90m average sits against a market capitalisation of $8.53bn (fit_features.market_cap, $17.29 close on 24 July 2026). The yield arithmetic belongs to Yield; what it means here is that today's adjusted free cash flow is a low bar for year 10 to clear, which cuts in favour of the gate, not against it.
The year-10 case
The strongest case that year-10 revenue and adjusted free cash flow are higher. Ten consecutive years of revenue growth through a pandemic and the 2022 advertising recession; revenue 14.3 times its 2016 level. The pool is growing — the filing puts digital advertising above $700bn and total advertising past $1tn, with the linear-to-connected-television shift early [46]. Adjusted free cash flow is compounding hard off a low base, from minus $37m in 2022 to $302m in 2025, and the operating leverage that produced it — stock compensation flat in dollars against 84% revenue growth — has further to run. The balance sheet cannot force the outcome: $658m of cash and $645m of short-term investments at year-end 2025 [47], about $1.4bn of cash and short-term investments at the end of Q1 2026 [48], and no debt drawn on the $450m revolving credit facility at year-end 2025 [49]. And consensus underwrites growth, not decline: fit_features.consensus_forward_yield carries mean free-cash-flow estimates rising from $780m in FY2026 to $1,098m in FY2029. Even a decade of 5% growth from here leaves year-10 revenue near $4.7bn.
The strongest doubt. Not one of the five conviction sources applies, on the company's own filed description of its industry, its contracts and its assets — so year-10 protection rests on out-executing Google and Amazon in a market the company itself calls fragmented, and the framework does not accept execution as a moat. The volume measure is decelerating faster than the revenue measure: gross spend grew 11% in 2025 against 25% in 2024, and 39% of the year's revenue increase came from a take rate that rose to 21.6% while the company's own risk factor names compression as the mature-market direction and a competitor with $68.6bn of advertising revenue [50] is described by a rival platform as being in the market at 1% fees [51]. Two holding companies each control more than 10% of gross billings, and one of them withdrew its recommendation for three months in 2026 over exactly that fee question. Amazon has told its own shareholders that its demand-side platform is now "fully featured" and that access to Roku's 80 million connected-television households runs "exclusively" through it — in the same quarter The Trade Desk's chief executive told his shareholders he doubted Amazon would build such a platform at all in the next ten years. Both statements cannot be right in year 10.
The read. The framework's gate is not met. The doubt is not that revenue declines — the disqualifier is checked and absent, and the base case on this evidence is continued growth — but that year-10 revenue and adjusted free cash flow cannot be underwritten with very high conviction when the protection is execution plus a price that a customer has already challenged and a far larger competitor can undercut to zero. Under the framework's own construction, any proper doubt resolves the same way, and this doubt is specific, cited and quantified rather than atmospheric.
What would change it, in order of how much weight each carries: gross-spend growth running at or above revenue growth for four consecutive quarters, which would show volume rather than price doing the work; the two holding-company concentrations falling below 10% each without a revenue step-down; and a multi-year record of premium connected-television supply staying biddable on independent platforms after the Roku arrangement. The first is measurable in the next two filings.
What this tab establishes
The balance sheet is not the constraint. At March 31, 2026 The Trade Desk held $1.41 billion of cash and short-term investments, no funded debt, and an undrawn $750 million revolver running to 2031 [1] [2]. The constraint is arithmetic scale. Since February 2023 the company has committed $2.45 billion to retiring 45.9 million shares at an average of $53.23 against today's $17.29, and the share count is down only 4.0%, because stock compensation reissued 26.5 million of them.
The balance sheet against the problem's duration
Cash + Investments ($M)
Funded Debt Drawn ($M)
Committed Revolver ($M)
Working Capital ($M)
Source: Q1 FY2026 Form 10-Q, Condensed Consolidated Balance Sheets [3] and Note 6—Debt [4].
Cash and equivalents were $878.4 million and short-term investments $527.5 million at March 31, 2026, against total current liabilities of $2.89 billion, of which $2.63 billion is accounts payable owed to inventory and data suppliers — the pass-through leg of a business that collects from agencies and pays media owners [5]. Working capital was $1.97 billion. There is no funded debt anywhere in the structure: the company reported no outstanding balance under its credit facility at December 31, 2025 and again at March 31, 2026, and cash paid for interest in FY2025 was $993 thousand — a letter-of-credit and commitment-fee figure, not a debt-service figure [6] [7]. The revolver has been drawn once in the company's history, for $143.0 million in 2020, repaid within the same year [8].
The financing arrangement changed shape in April 2026. The old $450 million facility was due to mature on June 15, 2026 [9]. On April 14, 2026 the company replaced it with a restated $750 million revolving facility maturing April 14, 2031, with a further $750 million accordion, collateralised by substantially all assets subject to release on reaching investment grade, priced at term SOFR plus 112.5 to 150 basis points, an undrawn fee of 12.5 to 20 basis points, and a maximum net-funded-debt-to-EBITDA covenant of 3.50 to 1.00 [10] [11]. Nothing was drawn at signing and nothing has been drawn since. Two facts sit either side of that: the terms improved, since the old facility priced at SOFR plus 125 to 225 basis points and charged 20 to 35 basis points undrawn; and the size rose 67% while the company was repurchasing stock and drawing down its cash reserves [12].
Refinancing risk at current rates does not arise, because there is nothing to refinance. Covenant risk is equally remote: FY2025 adjusted EBITDA of $1.20 billion against a 3.50x net-leverage test implies roughly $4.2 billion of permitted funded debt, more than five times the committed facility [13]. The company was in compliance with all covenants at both dates [14] [15].
The maturity ladder, year by year
With no funded debt outstanding, the only contractual maturity schedule in the footnotes is the lease ladder.
Source: FY2025 Form 10-K, Note 8—Leases, maturities of lease commitments as of December 31, 2025 [16]; no funded debt outstanding per Note 7—Debt [17].
Undiscounted lease commitments total $795.2 million, of which $291.0 million relates to leases not yet commenced; the present value of recognised lease liabilities is $436.3 million, with a weighted-average remaining term of 5.5 years at a 4.8% discount rate [18]. Alongside the leases sit other non-cancelable commitments for hosting, hardware and software of $226.7 million due in 2026 and $39.1 million in 2027 and thereafter, plus $92 million of new cloud and data commitments signed in January 2026 and running to 2028 [19]. Every one of those obligations is covered several times over by FY2025 operating cash flow of $992.7 million [20].
The company can outlast this problem for as long as it takes, and nothing on the liability side can force capital allocation away from repurchases. The fact that qualifies a purely comfortable reading is the trajectory of the cash pile rather than its level: cash plus short-term investments fell from $1.92 billion at December 2024 to $1.30 billion at December 2025 [21], because FY2025 repurchases of $1.38 billion exceeded FY2025 free cash flow of $795.7 million by $585 million [22] [23]. Receivables are lengthening too — days sales outstanding moved from 97 days exiting Q4 2024 [24] to approximately 100 days exiting Q4 2025 — so the cash balance is a seasonal figure inside a large gross receivable and payable book rather than a static reserve [25].
The repurchase record — executed, not authorized
The program is real, large and recent. It began in February 2023, when the board authorized $700 million and the then-CFO announced it on the Q4 2022 call: "our strong profitability and cash flow enables us to return capital to shareholders, with a $700 million share repurchase program" [26]. Authorizations have been topped up four times since — $647 million in February 2024, $564 million at the end of January 2025, $500 million in October 2025 and $350 million in February 2026, for $2.76 billion cumulatively authorized [27].
Sources: cash spent from the consolidated statements of cash flows [28] [29]; shares retired and period-end counts from the statements of stockholders' equity [30] [31] [32]; average price derived as recognised repurchase value, which is struck on a trade-date basis and includes the 1% excise tax, divided by shares retired. No repurchases occurred before the program was approved in February 2023.
Executed against authorized: $2.45 billion of repurchase value recognised, of which $2.43 billion had settled in cash through March 2026, against $2.76 billion authorized [33], with $327 million still available at March 31, 2026 [34]. This is not an authorization without execution. The CFO put the cumulative figure on the record on the Q3 2025 call: "Going back to our first authorization in 2023, the company has repurchased nearly $2 billion through our repurchase program, effectively offsetting dilution and reducing shares outstanding over that time" [35].
Prices paid against today's price
Source: average prices derived from shares retired and recognised repurchase value in the statements of stockholders' equity [36] [37]; current price of $17.29 at July 24, 2026 from the daily price series.
Across the whole program the weighted-average price paid is $53.23 — $2,445.8 million for 45.9 million shares. At $17.29 the company has paid 3.08 times today's quote for the stock it retired, a mark-to-market shortfall of about $1.65 billion. Two-thirds of the spend happened above $50 a share. That is the cost of running an opportunistic program into a chart that fell 88% from its December 2024 peak, and it is the strongest single fact against reading capital allocation as a source of shareholder value in this episode.
The dilution treadmill
The filings describe the purpose of the program in exactly one way: it "is designed to help offset the impact of future share dilution from employee stock issuances" [38]. The share-count record shows the description is accurate.
Sources: consolidated statements of stockholders' equity, FY2022 and FY2025 10-Ks and the Q1 FY2026 10-Q [39] [40] [41].
The arithmetic between the gross and the net: 45.9 million shares were bought and retired between February 2023 and March 2026, while the count fell from 490.5 million at December 2022 to 471.0 million at March 2026 — a reduction of 19.5 million, or 4.0%. The gap of 26.5 million shares was reissued to employees. Fifty-eight percent of every repurchase dollar went to standing still. Per share of net reduction the program cost $125.62 of cash, against a share price of $17.29.
The dilution being offset is not a rounding item. Stock-based compensation has run at roughly half a billion dollars a year for four straight years while free cash flow has been climbing toward it.
Adjusted FCF = reported free cash flow − stock-based compensation expense − trailing five-year average acquisition spend; derived from the consolidated statements of cash flows in the FY2022 and FY2025 10-Ks [42] [43]. The deterministic feature file records adjusted FCF as not computable because its cash-flow feed carries no stock-compensation field, so this series is computed from the filed statements and is not the feature file's figure.
FY2025 stock compensation of $490.6 million equalled 16.9% of revenue and 61.7% of reported free cash flow [44]. Adjusted free cash flow on the framework's definition is $795.7 million − $490.6 million − $3.5 million of five-year average acquisition spend, or $301.6 million — 3.5% of the $8.53 billion market capitalisation, against the 8 to 9% reference line the framework applies to a net-cash balance sheet. The computation of the yield itself belongs to Yield; what matters here is what $301.6 million buys.
There is a second-order effect worth recording. Grants are struck in dollars, so a falling share price issues more shares for the same expense. Restricted stock issued net of forfeitures and withholding was 1.83 million shares in Q1 2026 against 0.78 million in Q1 2025 — 2.3 times as many shares for 15% less expense [45] [46]. Options granted in Q1 2026 alone came to 2.68 million shares at a $25.30 strike, against 4.58 million for the whole of FY2025 at $52.11 [47] [48]. Behind that sits 106.8 million shares still available for grant at December 31, 2025, increased by a further 19.0 million on January 1, 2026 — together 26.7% of the shares outstanding [49]. The treadmill gets steeper as the price falls, which is when repurchases are supposed to be most valuable.
Where the framework's share-count condition lands
The framework excludes companies whose share count keeps rising on stock compensation or serial acquisition. The deterministic feature file records share_count_trend.rising: true, with a five-year compound growth rate of +0.15% a year. Serial acquisition is not the mechanism: acquisition spend was $13.3 million in FY2021 and $4.4 million in FY2025 against $2.9 billion of revenue [50] [51].
The filed record dates that trend precisely. The count rose in every fiscal year from 2019 through 2024 except for a 0.3% dip in 2023 — including 2024, when $234.8 million of repurchases was overwhelmed by issuance and the count rose 1.5% to 496.1 million [52]. It turned down in 2025 by 4.1%, and again in Q1 2026 by 1.0%. The turn was bought rather than earned: FY2025 repurchase spend was 1.7 times reported free cash flow and 4.6 times adjusted free cash flow, funded by drawing the cash pile down $618 million [53]. So the condition the framework screens for described this company through FY2024 and stopped describing it in FY2025, at prices above $50 a share, using balance-sheet cash rather than operating cash. How long it keeps not describing it is a function of that cash: $1.41 billion of net cash covers about 2.4 years of the FY2025 gap between repurchases and free cash flow, after which repurchases fall back toward $301.6 million a year, or 3.5% of the float at today's price.
Management's buyback intent, from the record
Across the last six calls the intent language is stable and bounded. In five of those six the CFO closed the capital-allocation paragraph the same way: the company will "continue opportunistic share repurchases, while also offsetting dilution from employee stock issuances" [54] [55] [56] [57] [58]. Asked on the Q4 2024 call about 2025 investment priorities, the then-CFO gave the fullest statement of philosophy on the record: "as I've always said, we take an opportunistic approach to our share repurchase program. We are guided by market conditions on our capital priorities" [59].
Debt paydown has never competed for the money, because there is no debt, and acquisitions have not competed either — $4.4 million of acquisition spend in FY2025 is the largest figure since 2021 [60]. What competes is capital expenditure: management framed 2026 as a year of disciplined reinvestment on both the Q4 2025 and Q1 2026 calls [61] [62], and purchases of property and equipment doubled to $197.0 million in FY2025 and ran at $112.7 million in Q1 2026 alone [63] [64].
Two absences belong in the record. No analyst asked a question about the buyback, the balance sheet or capital allocation on the Q3 2025, Q4 2025 or Q1 2026 calls; every reference to repurchases in those three calls sits in prepared remarks. And the sentence "we had no debt on the balance sheet," present in the Q3 2025 and Q4 2025 financial remarks, is absent from the Q1 2026 remarks delivered three weeks after the secured $750 million facility was signed [65] [66] [67]. The 10-Q confirms nothing was drawn, so that change is one of script rather than substance — but the script changed.
Execution against the low
The Q1 2026 monthly detail is the sharpest available test of "opportunistic," and the answer is mixed. The company bought nothing in January, with $150 million of authorization available, and nothing in February, with $500 million available after the February top-up, then bought all 7.1 million shares in March at an average of $24.31 [68]. The stock traded as low as $21.28 during the quarter. Quarterly deployment has also fallen as the price has fallen — $423 million in Q4 2025 at an average near $41, then $164 million in Q1 2026 at $24 [69] [70] [71]. The binding constraint looks like the authorization ceiling rather than conviction: $327 million was left at March 31, 2026, equal to 3.8% of the market capitalisation [72].
Insider buying
The founder-CEO put $148.1 million of his own cash into the stock over three trading days. Jeff Green bought 6,000,000 Class A shares in the open market on March 2, 3 and 4, 2026 at prices between $23.49 and $25.08, an average of $24.68, filed as code P purchases rather than option exercises [73]. Across the 152 Form 4 transactions in the record, his are the only open-market purchases [74]. He was buying in the same weeks the company was, at close to the same average price, and the stock now sits 30% below what he paid.
Set against it, four insiders sold into the same decline, none in comparable size. Kathryn Falberg, then a member of the audit committee [75] and a director since August 2016 [76], sold 152,828 shares at $30.45 and $30.48 on March 5, 2026 — the day after Green's last purchase — and resigned from the board on March 23 [77] [78]. Samantha Jacobson sold 53,681 shares at $21.14 on May 28, 2026, ten days after resigning as chief strategy officer [79] [80]. The other two sold earlier and smaller: the chief legal officer sold $4.7 million under a 10b5-1 plan in August 2025 and a director sold $68,000 in September 2025 [81]. Green's purchase is fourteen times the combined value of every insider sale in the record, and it is the strongest fact in this tab on the supportive side of the ledger.
The absurdity check
The feature file records float_retirement_years as not computable, because adjusted free cash flow could not be derived from its cash-flow feed. Computed from the filed statements instead:
Market capitalisation of $8,533 million at $17.29 on July 24, 2026, divided by FY2025 adjusted free cash flow of $301.6 million, gives 28.3 years to retire the entire float. On reported free cash flow of $795.7 million — before deducting the $490.6 million of stock compensation that is a real cost of keeping the engineers — the same calculation gives 10.7 years [82].
The framework's reference case is a price at which about three years of adjusted free cash flow buys the company. Twenty-eight is not that number, and neither is eleven.
The levered exception
The exception the framework allows for indebted companies requires a very high adjusted yield, around 25%, together with a demonstrated multi-year share-count reduction and free cash flow to revenue that is not deteriorating. The first leg settles it: the adjusted yield is 3.5%, not 25%, so the gate never opens. For completeness, the second leg is partly satisfied — a 5.1% reduction over five quarters, against a five-year trend that is still marginally upward — and the third is satisfied, with adjusted free cash flow to revenue improving from 2.9% in FY2023 to 10.4% in FY2025. Two of three would not be the exception in any case, and the exception is aimed at levered balance sheets; this one holds net cash, which places it on the 8 to 9% reference line rather than the 25% one.
Dividend
No dividend forms part of this case. The company has never declared or paid one, does not anticipate paying one, and the credit agreement restricts its ability to do so; the stated intention is to retain earnings for operations, expansion, or repurchases of Class A stock [83]. The dividend-coverage test does not apply.
Management credibility
Promise versus delivery
Five material commitments made two to four years ago, checked against what happened.
Sources: Q4 FY2022 [84], Q3 FY2023 [85] and Q2 FY2024 [86] transcripts; the Q4 2024 guidance as given on the Q3 FY2024 call [87], and the shortfall as acknowledged on the Q4 FY2024 call [88]; share counts from the statements of stockholders' equity [89].
Two of the five were delivered squarely, one was missed and owned, two are mixed. The ownership matters to the read. On February 12, 2025 the CEO opened the call with it: "for the first time in 33 quarters as a public company we fell short of our expectations… but for the first time in 8 years, we missed the expectations we set, and it was our fault" [90]. Since that miss the numeric guidance record has been clean: every quarterly revenue and adjusted EBITDA guide from Q1 2025 through Q1 2026 was met. One commitment is outstanding and worth watching — a full-year 2026 adjusted EBITDA margin of at least 40% against a Q1 2026 margin of 30%, which requires materially higher margins across the balance of the year [91]. That target is struck after adding back stock compensation [92]; FY2025 GAAP operating margin was 20.3% and Q1 2026 net margin 5.8% [93] [94].
The record is weakest on strategic claims that carried no date. The narrative through 2023 and 2024 asserted that share gains were independent of conditions; the narrative in 2026 attributes deceleration to conditions. On the Q4 2025 call the framing was "Even though we have not harvested most of those seeds, we are seeing green shoots and are extremely confident that we've made the right moves" [95]; on the Q1 2026 call it was "the macro environment has certainly become more complex in 2026" [96]. Neither carries a quantified path back to faster growth.
Insider economic ownership
The founder's stake is large and he added to it in cash. As of March 6, 2026 Green held 11,483,384 Class A and 42,071,879 Class B shares — 11.2% of the shares outstanding, worth about $926 million at $17.29 [97]. His FY2025 compensation was $27.4 million [98], and his 2021 performance option — 17.8 million shares at a $68.29 strike, with the next vesting tranche at $145 and the top tranche at $340 — carried no intrinsic value at December 31, 2025 and carries none today [99] [100]. On the framework's exclusion test — a promotional chief executive without skin in the game, managing to next quarter's number — the evidence runs the other way: the ownership is real, the one miss was owned, and a $148 million cash purchase at the lows is the opposite of an exit.
The governance facts that cut against it
The same holding carries 49.7% of total voting power, because Class B has ten votes a share [101]. In September 2025 stockholders approved an amendment extending the automatic conversion of Class B into Class A to December 22, 2035; on December 9, 2025 Nasdaq issued a letter of reprimand finding that the amendment violated its voting-rights rule, which the company disputes but did not appeal [102] [103]. The company also reincorporated from Delaware to Nevada, which remains the subject of a stockholder fiduciary-duty action [104].
A consolidated federal securities class action covering purchases from November 15, 2023 to August 8, 2025 alleges false and misleading statements and adds a Section 20A count alleging that the chief executive, then-chief financial officer and chief strategy officer traded on inside information during the class period; the motion to dismiss was pending at the FY2025 filing, and a derivative action is stayed behind it [105]. Management states that it believes the claims meritless.
The turnover is the hardest fact to read benignly. Four directors left between March 3 and April 3, 2026 — Gokul Rajaram, Alexander Kayyal, Kathryn Falberg and Lise Buyer [106] [107] — leaving the board at five [108] and out of compliance with Nasdaq's audit- and compensation-committee composition rules, with a cure deadline of September 21, 2026 [109]; replacements were appointed in April, June and July 2026 [110]. [111] The finance seat has turned over four times in eighteen months: Laura Schenkein, then Alex Kayyal from August 2025 [112], then Tahnil Davis as interim, then Nate Olmstead effective July 9, 2026 [113]. Kayyal's separation included a $400,000 relocation payment [114].
Taken together, this is not the promotional pattern the framework excludes: the misses are one rather than repeated, that one was owned in plain language, and insider ownership is 11.2% of the equity plus a $148 million cash purchase at the lows. It is a governance profile with a founder holding half the votes on a tenth of the economics, a board that emptied in five weeks, and unresolved securities litigation naming the officers who set the guidance. What would move the read either way is observable and dated: a full-year 2026 adjusted EBITDA margin at or above 40%, and whether the repurchase pace survives the exhaustion of the net cash that funded FY2025.
Clock
Nothing in this setup resets on a calendar. The re-rating path runs through printed quarters: Q2 2026 on August 6, the first Publicis-clean quarter in early November, and the quarter where consensus itself has growth reaccelerating — Q4 2026, printed late February 2027. This name's own history holds no drawdown of comparable depth; the deepest prior, 64% in 2021–22, took 2.9 years round trip. Listed options run to January 2028; 30-day implied volatility was 84.6% on July 24, 2026.
The Re-Rating Mechanism
The framework's strongest clock is an industry that reprices on a schedule — premiums reset, contracts renew, and mean reversion happens whether or not the company executes. Programmatic advertising has no such schedule. There is no regulated rate filing, no annual premium round, no cost-trend true-up. What TTD has instead is a set of mechanisms with different degrees of "already in motion," and none of them is mechanical.
Growth stabilizing against an easier base. Reported revenue growth has decelerated in four consecutive quarters, from 25.4% in Q1 2025 to 11.8% in Q1 2026. Management guided Q2 2026 to "at least $750 million" [1], which computes to 8.1% growth against the $694.0M Q2 2025 base. Consensus places the trough there and has growth back to 11.0% by Q4 2026. Evidence it is in motion: TTD signed 45 joint business plans in March 2026 alone, with total JBP count up 55% year over year and new-deal spend up 40% [2]. Window: visible in the Q3 2026 print (early November 2026) and confirmable in Q4 2026 (late February 2027).
A named counterparty dispute rolling off. Publicis paused client spend on the platform in March 2026 following an agency-commissioned audit of TTD fee practices; the two settled privately and the agency resumed in June 2026 [3]. On the Q1 call the CEO said only that "our negotiations are ongoing" about the next chapter of the partnership [4]. The arithmetic consequence is a calendar one: the pause sits inside the April–June quarter that reports on August 6, and Q3 2026 is the first quarter carrying restored spend for its full length.
The denominator. $327 million remained authorized for repurchase at March 31, 2026 [5]. At the $17.29 close of July 24, 2026 that retires 18.9 million shares, or 4.0% of the 471.0 million Class A and Class B shares outstanding at quarter-end (427.890M plus 43.109M) [6]. The counter-fact sits in the same filing: the program is "designed to help offset the impact of future share dilution from employee stock issuances" [7], and Q1 2026 stock-based compensation ran $109 million (total operating expense of $622 million against $513 million excluding SBC) [8] — roughly $436 million annualized, more than the remaining authorization. Net of issuance, the outstanding count fell 1.03% in the quarter, from 475.923M to 470.999M [9]. Successive top-ups have been shrinking even as the price fell: $647 million in February 2024, $564 million at end-January 2025, $500 million in October 2025, $350 million in February 2026 [10]. The share-count mechanics are worked in full in Self-Help.
A feared event failing to happen. The fear is displacement of the CTV franchise by a demand-side platform owned by an inventory owner; the FY2025 10-K names the shape of it, describing competitors that "are divisions of large, well-established companies such as Google and Amazon" [11]. This one has no date attached to it at all. TTD does not disclose CTV revenue, so the only quarterly read is channel mix — video including CTV was a low-50s percentage of the business in Q1 2026 and still rising as a share of mix [12]. Absence of displacement is provable only by accumulation, which is the slowest form of proof.
Cost normalization is not available here. Management guided the full-year 2026 adjusted EBITDA margin to "at least 40%, approximately in line with 2025" [13], and Q1 operating expense excluding SBC grew 18% against 12% revenue growth [14]. There is no depressed margin waiting to recover, so no margin-recovery catalyst exists to be dated.
Dated Catalysts
Sources: Q2 2026 reporting date, Publicis resolution and CFO appointment from the news record [15]; guidance from the Q1 FY2026 call [16]; repurchase authorization from the Q1 FY2026 Form 10-Q [17] and the February authorization pattern from its Item 2 repurchase disclosure [18]; litigation status from the same filing [19]; consensus quarterly revenue from CapIQ estimates.
Two of these deserve their timing stated rather than assumed. The securities class action — brought over alleged Kokai misstatements [20], on behalf of purchasers between November 15, 2023 and August 8, 2025 — survived dismissal in full on March 17, 2026, with the company filing its answer on April 30, 2026 and describing the case as "still in its early stages" [21]; the consolidated derivative actions are stayed "until the close of fact discovery in the securities class action" [22]. A securities case entering discovery in mid-2026 does not resolve inside the 18-month window; it is an overhang that persists through it, not a catalyst within it.
The second is insider conviction, which arrived on a date and at a price. Form 4s filed March 4, 2026 record CEO Jeff Green buying 6,000,000 Class A shares on March 2–4 for $148.1 million, at an average of about $24.68 [23]. The stock rose 18.4% on March 5, 2026, the session after the filing. The counter-facts are in the same register and the same filing: director Kathryn Falberg sold 152,828 shares on March 5 at $30.45–30.48 [24], and the company's own March repurchases of 7.1 million shares were executed at an average of $24.31 [25]. At $17.29 both the CEO and the company are roughly 29–30% underwater on those purchases, and the March re-rating they produced has fully unwound.
Drawdown Base Rates
Since the September 2016 listing, TTD has had eight drawdowns of 30% or more measured on closing prices. Seven completed and recovered to the prior peak; the eighth is the current one.
Source: derived from the run's daily closing-price series, 21-Sep-2016 to 24-Jul-2026; episodes defined as a fall of 30% or more from a running peak close, with the trough taken as the lowest close before the prior peak is regained. Company filings, as reported.
Source: derived from the run's daily closing-price series; months computed as calendar days divided by 30.44. The Dec 2024 episode has no round-trip figure because the prior peak has not been regained. Company filings, as reported.
The arithmetic a skeptic should recompute: the current depth is 16.79 divided by 139.51 minus one, or −87.97%, over 596 calendar days from the December 4, 2024 peak to the July 23, 2026 low — which was set one session before the July 24 close of $17.29. The deepest prior episode is 39.89 divided by 111.64 minus one, or −64.27%, over 358 days to trough and 1,053 days (2.88 years) from peak back to peak.
Across the seven completed episodes the median depth was 35.6%, the median time to trough 89 days, and the median round trip 165 days — a little under six months. The current episode is 24 percentage points deeper than anything in the record and has already run 6.7 times the median length to a trough that is only provisional. This name's history contains no precedent for the present episode, and the base rate therefore cannot be read as a timing estimate.
The 2021–22 episode is the closest analogue in kind, and it is instructive precisely because it was not an earnings event: revenue grew 31.9% that year, from $1,196M in FY2021 to $1,578M in FY2022, while the stock fell 64.3%. That is the quality-franchise pattern — price swinging far more than value — and it took 2.88 years to unwind. The present episode does not have the same anatomy. Revenue has kept growing (FY2024 $2,445M, FY2025 $2,896M, FY2026 consensus $3,177M), but the growth rate has gone from 25.6% to a consensus 9.7%, so this is a de-rating with a deceleration inside it rather than pure multiple compression. On sales multiples: about 28.6 times FY2024 revenue at the December 2024 peak (139.51 times 501.9M shares), against 2.7 times FY2026 consensus revenue at the current $8.53 billion market cap. That range is also the framework's first hard exclusion — a high-growth name on an extreme multiple to sales — and it applied to this name at the peak; the universe test on the current $8.53 billion capitalization against the framework's $10 billion floor is worked in Fit and Business.
One base rate does exist and is worth stating with its caveat. Measuring forward from each of the seven prior troughs, the median 12-month gain was +171% and the median 24-month gain +377%. Every one of those troughs occurred while revenue was compounding between 23% and 55% a year. Consensus for FY2026 is 9.7% and for FY2027 9.6%. The recovery base rate is drawn from a materially different business, and applying it to the current one would be a category error.
Street Positioning
Mean target price
Upside to mean target
Analysts with a rating
Rated hold or lower
Source: CapIQ street consensus as captured in this run (30 target-price contributors, 36 rating contributors); price from the run's daily closing-price series, 24-Jul-2026.
Source: CapIQ consensus recommendation detail as captured in this run; consensus recommendation score 2.53 on a 1-to-5 scale.
The sell side has moved its ratings but not its numbers. Nineteen of thirty-six analysts sit at hold and four more at underperform or sell, producing a consensus score of 2.53 — the distribution of a group that has stopped defending the story. Yet the mean target of $24.32 is 40.7% above the last close, the median $24.50, and the range runs from $11 to $38 — a 3.5-times spread between the low and high marks. That dispersion is the signature of an unresolved binary rather than a capitulated tape: the low mark implies 36.4% further downside from here, the high mark implies the stock roughly doubling, and the same set of forecasters holds both.
The forward numbers have not capitulated either. Consensus free cash flow computes to a 9.1% yield on the $8.53 billion market cap for FY2026, 10.4% for FY2027 and 11.3% for FY2028 (fit_features.consensus_forward_yield). Under the framework's consensus check, that is the configuration where the sell side's own estimates clear the moderate bar while the tape prices something considerably worse. One qualification belongs with it: consensus free cash flow is struck before stock-based compensation, and the framework's adjusted basis subtracts SBC — which ran $109 million against $276 million of Q1 2026 free cash flow [26]. The deterministic feature file could not compute adjusted FCF for any year (SBC is absent from the structured cash-flow record), so the adjusted yield and its position against the 10% bar are established in Yield, not here.
The Candidate Quarter
Source: reported revenue from the run's quarterly income statements (Q1 2025 $616.0M through Q1 2026 $688.9M); forward quarters from CapIQ consensus means ($751.6M, $804.7M, $940.1M). Company filings, as reported.
Consensus itself answers the question of when recovery shows up in printed numbers: it does not expect one. It expects a trough and a partial recovery. The 8.3% consensus for Q2 2026 is the low point of the series, Q3 recovers 0.5 of a percentage point to 8.8%, and Q4 2026 reaches 11.0% — still below the 11.8% just reported. Full-year 2026 computes to 9.7% and 2027 to 9.6%, so consensus has growth settling in the high single digits to low double digits rather than returning to the twenties.
That makes Q4 2026, printed in late February 2027, the candidate quarter — the first period where consensus has growth accelerating rather than decelerating, on a base ($846.8M in Q4 2025) that already reflected the deceleration. It sits about nineteen months from today. The quarter before it, Q3 2026 in early November, is the more informative one for the mechanism rather than the re-rating: it is the first quarter carrying restored Publicis spend for its full length, and the first full quarter under the new CFO, so a Q3 print at or below the Q2 growth rate would say the deceleration is not a counterparty effect.
The 18-Month Read
Re-recognition toward the street's own mean target inside 18 to 24 months is a reasonable expectation on the evidence assembled here, and recovery of the drawdown itself is not. The distinction matters because the two carry different arithmetic: the mean target of $24.32 asks for 40.7% and requires only that the consensus trough hold and print; the December 2024 peak asks for 707% and has no support in the mechanism list at all.
The evidence for the first half of that read: the price at $17.29 is discounting materially worse than consensus, which still carries FY2027 revenue growth of 9.6% and free cash flow of $883 million; the two dated mechanisms with the shortest fuses (Publicis spend restored June 2026; $327 million of authorization at a price that retires 4.0% of the shares) are both in motion now; and consensus itself puts the growth trough in the quarter reporting August 6, 2026.
The evidence against the second half, and the harder constraint: nothing here resets mechanically. Every mechanism above requires the business to print, which makes this an execution clock — the slowest kind. The one comparable-depth episode in this name's own record took 2.88 years peak to peak from 24 points less depth, and it recovered on 32% revenue growth that no longer exists. The securities litigation entered discovery in 2026 and runs through the whole window. Three CFOs in twelve months means the executive who will own the guidance has been in the seat since July 9, 2026 [27], and the current low was set on July 23, 2026 — one session before the last close — so there is not yet a trough to date the clock from.
What would falsify the read: a Q3 2026 print (early November 2026) with revenue growth at or below the Q2 trough rate of roughly 8% with Publicis spend restored for the full quarter, or a cut to the "at least 40%" full-year 2026 adjusted EBITDA margin guide [28]. Either would move the diagnosis from a cyclical and counterparty trough to structural share loss, at which point the mechanism list above has nothing left in it. This is the name-specific version of the framework's "repricing cycle fails to materialize" falsifier, and it is carried into the ledger in Fit.
Instrument Facts
Stated as facts, with their dates.
Long-dated listed options exist. The TTD option chain quoted on July 24, 2026 (last price $17.29, matching that session's close) carries expirations through January 21, 2028 — approximately 18 months forward — alongside January 15, 2027, March 19, 2027 and June 17, 2027 (source: Stock Options Channel TTD option chain, as of the July 24, 2026 close). Because qualifying long-dated contracts exist, the framework's watchlist-only routing for names without them does not apply to TTD.
Liquidity, at a high level. That same July 24, 2026 session showed 24,599 call contracts and 10,162 put contracts traded, a put-to-call volume ratio of 0.41 (source: Stock Options Channel, July 24, 2026). The underlying is an S&P 500 constituent, added July 18, 2025 [29], and traded a 20-day average of 12.7 million shares, or $236 million a day, through July 24, 2026 (run technical data). Aggregate open interest could not be obtained from a citable source; the volume figures above are the liquidity evidence this tab can stand behind.
Implied volatility, dated. TTD's 30-day mean implied volatility was 84.63% and its 180-day mean implied volatility 72.54%, both for the session dated 2026-07-24 (source: AlphaQuery TTD option volatility statistics, figures for 2026-07-24). The framework's reference lines are up to roughly 50–55 as acceptable and 60–70 as elevated; both figures sit above that elevated band — the 180-day measure by 2.5 points and the 30-day measure by 14.6 points, taking 70 as the upper edge. The 30-day figure spans the August 6, 2026 earnings date, which mechanically lifts it; the 180-day figure is the closer read on the long-dated part of the curve, and it is still above the band.
No strike, expiry, structure, or sizing is suggested anywhere in this tab. These are the instrument facts as of July 24, 2026; the framework's use of them belongs to the reader.